Team analysis · 2027 roster planning
Give the Angels a dependable middle
November 3, 2026 edition
The complete review
November 3, 2026 edition. Completed 2026 regular-season performance with November 3 roster, transaction and market checks. The full website analysis includes 23 evidence and planning tables; the 28-page PDF is suitable for forwarding. Proposed prices and workloads are scenarios.
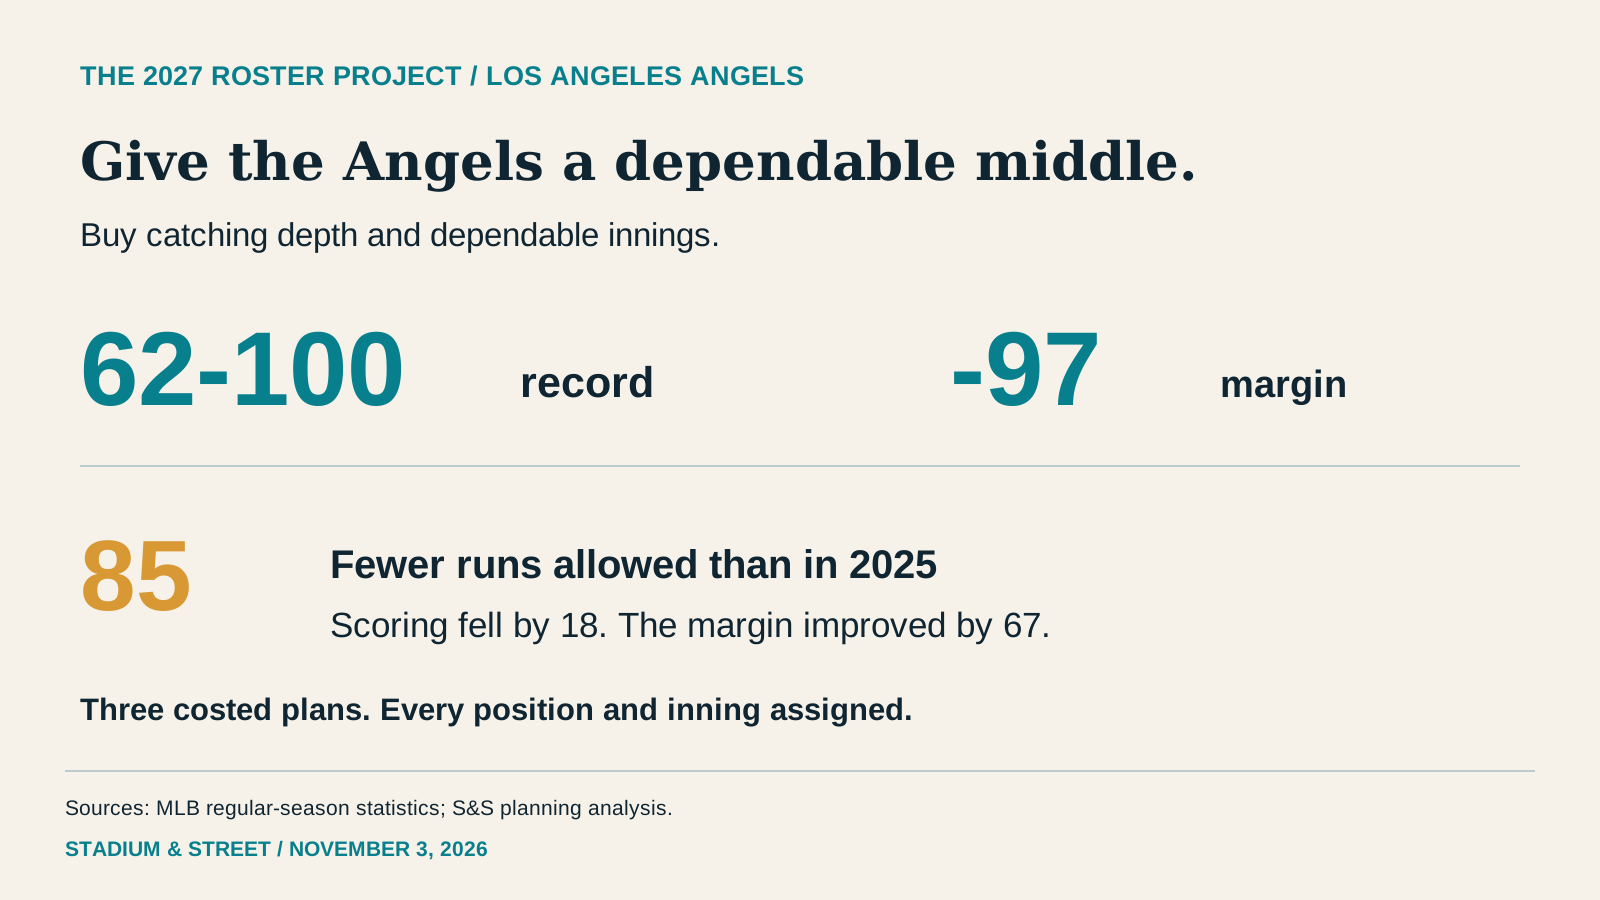
The decision in one page
The Angels prevented 85 more runs in 2026 than they had the year before. They still lost 100 games. That combination should shape the offseason: retain the pitching gains that have credible underlying support, improve the weak positions around them and resist paying as though one famous addition will close the entire gap.
Our preferred plan buys Carson Kelly for a defined catching share, Tyler Mahle for 150 rotation innings and Taylor Clarke for 65 relief innings. The proposed annual allocations are $8-10 million, $14-16 million and $4-6 million. A separate $6-8 million depth reserve brings annual additions to $32-40 million. The resulting player-allocation envelope is approximately $137.02-149.02 million, before unknown deferred cash installments. These are S&S negotiating limits, not reported offers or a verified club budget.
The plan gives Christian Moore and Denzer Guzman substantial opportunities without requiring either to solve several positions at once. It leaves center field to Jose Siri, Bryce Teodosio and a conditional Nelson Rada promotion. It keeps Mike Trout's bat in the lineup while assigning more work away from the outfield. It also makes the catching decision explicit: Kelly takes work that otherwise falls to Moises Ballesteros, Tyler Heineman and Logan Porter.
The alternative buys Trent Grisham for center field and leaves Mahle's innings to the organization. It costs less, but its pitching burden is materially riskier. A third path makes no major acquisition. That version balances the workload on paper and exposes exactly where the current roster remains thin. The choice is between different uses of money and playing time, not three interchangeable shopping lists.
Better run prevention, fewer wins
Los Angeles went 62-100 with 655 runs scored and 752 allowed. Its minus-97 margin improved by 67 runs from 2025, while its win total fell by ten. Scoring declined by 18 runs, and home runs fell from 226 to 154. The lineup's .679 OPS left little room for mistakes even after the pitching staff reduced its ERA from 4.89 to 4.29.
| Season | Record | Runs for / against | Margin | OPS / ERA |
|---|---|---|---|---|
| 2024 | 63-99 | 635 / 797 | -162 | .670 / 4.56 |
| 2025 | 72-90 | 673 / 837 | -164 | .695 / 4.89 |
| 2026 | 62-100 | 655 / 752 | -97 | .679 / 4.29 |
The completed schedule provides useful context. The Angels went 19-29 in one-run games and 6-14 in extra innings. Those groups overlap, so their deficits cannot be added. A simple squared run-ratio calculation produces about 69.9 wins from the full season's scoring totals, roughly eight more than the actual result. That is a description of how aggregate runs translated into wins, not evidence that all eight will return automatically.
Sequencing, bullpen availability, defense and the timing of scoring can change individual games. The season totals alone cannot separate their causal contributions. The practical lesson is to improve repeatable skills, especially walks allowed, receiving depth and defensive coverage, while avoiding an offseason valuation built entirely on the record in close games.
Begin with the roster that remains
The November 3 official 40-man snapshot contains 37 players. Its administrative Active labels do not establish medical readiness. Jack Kochanowicz underwent Tommy John surgery in June; the club's September update lists a possible late-2027 return. He receives no innings in the preferred plan.
Several important 2026 Angels are no longer available to this roster. Logan O'Hoppe and Chase Silseth moved to Texas, Jose Soriano to Toronto, Jo Adell to Cleveland and Ryan Zeferjahn to the Cubs. Their Angels statistics describe the season just completed. They cannot also appear as retained 2027 production. Kyren Paris was claimed by the Mets, while Sebastian Rivero's outright assignment is distinct from a guaranteed major-league catching role.
| Player / MLB ID | Reconciliation | Treatment |
|---|---|---|
| Logan O'Hoppe / 681351 | Traded to Texas | No automatic retained major-league workload |
| Chase Silseth / 681217 | Traded to Texas | No automatic retained major-league workload |
| José Soriano / 667755 | Traded to Toronto | No automatic retained major-league workload |
| Jo Adell / 666176 | Traded to Cleveland | No automatic retained major-league workload |
| Ryan Zeferjahn / 666171 | Traded to Cubs | No automatic retained major-league workload |
| Kyren Paris / 677347 | Mets waiver claim October 29 | No automatic retained major-league workload |
| Sebastián Rivero / 665861 | Outright to Salt Lake October 29 | No automatic retained major-league workload |
| Travis d'Arnaud / 518595 | Free agency October 29 | No automatic retained major-league workload |
| Adam Frazier / 624428 | Free agency October 29 | No automatic retained major-league workload |
| Yoán Moncada / 660162 | Free agency October 29 | No automatic retained major-league workload |
| Jorge Soler / 624585 | Expired contract; free agent | No automatic retained major-league workload |
| Brent Suter / 608718 | Departed; historical contribution | No automatic retained major-league workload |
Anthony Rendon is a free agent, but his deferred obligation remains a financial issue. Robert Stephenson's club option was declined. The departures of Travis d'Arnaud, Adam Frazier, Yoan Moncada and Jorge Soler also change the competition for work. None of their expired salaries is carried forward as a retained-player commitment, and no hypothetical trade or non-tender is credited with savings before it occurs.
The three preferred signings would fill the present three 40-man openings. Rada and Camden Minacci would require later selection decisions, with corresponding space created under the rules then in effect. This season-long model does not claim that every named player fits on the active roster on Opening Day.
Trout and Neto still anchor the offense
Trout supplied 634 plate appearances, 107 walks and an .803 OPS. His .354 wOBA and .381 expected wOBA support the judgment that he remains a valuable offensive player. They do not guarantee a return to an earlier career peak. The proposed 550-PA allocation builds in room for rest and other hitters while preserving his central role.
Neto's 27 home runs and 704 plate appearances are the lineup's clearest combination of power and availability. The countercase is also visible: 215 strikeouts, a .336 wOBA against .317 expected wOBA, and 12 caught stealings alongside 24 successful steals. The plan assigns 650 PA and does not manufacture further improvement merely by extending his best stretches over a full season.
| Player / MLB ID | LAA PA | AVG / OBP / SLG | HR | BB / K |
|---|---|---|---|---|
| Zach Neto / 687263 | 704 | .239 / .330 / .436 | 27 | 70 / 215 |
| Mike Trout / 545361 | 634 | .242 / .382 / .421 | 22 | 107 / 165 |
| Vaughn Grissom / 687093 | 474 | .242 / .307 / .386 | 13 | 31 / 87 |
| Nolan Schanuel / 694384 | 446 | .276 / .351 / .385 | 7 | 42 / 58 |
| Oswald Peraza / 672724 | 370 | .226 / .282 / .334 | 7 | 17 / 111 |
| Josh Lowe / 666139 | 343 | .209 / .273 / .360 | 12 | 25 / 105 |
| Wade Meckler / 685133 | 337 | .300 / .373 / .387 | 3 | 32 / 63 |
| Denzer Guzman / 694203 | 304 | .219 / .266 / .336 | 8 | 17 / 78 |
| Jose Siri / 642350 | 251 | .241 / .296 / .417 | 10 | 15 / 80 |
| Moisés Ballesteros / 694208 | 177 | .199 / .260 / .280 | 3 | 13 / 46 |
| Christian Moore / 695681 | 147 | .187 / .252 / .276 | 2 | 11 / 48 |
| Tyler Heineman / 623168 | 113 | .192 / .238 / .232 | 0 | 3 / 11 |
| Bryce Teodosio / 669326 | 76 | .214 / .267 / .243 | 0 | 5 / 27 |
Schanuel offers a different skill set. He struck out 58 times and walked 42 times in 446 PA, with a .351 on-base percentage. Seven home runs and a .385 slugging percentage limit the offensive ceiling at first base. His value depends on reaching base, controlling the strike zone and converting defensive chances, rather than meeting an invented power benchmark for its own sake.
The table uses Angels-only batting samples. Ballesteros and Heineman also played elsewhere in 2026, so their full-season comparison rows below intentionally contain different plate-appearance totals. Mixing those populations would overstate or understate the evidence for the player the Angels actually acquired.
Development must survive the major-league test
Moore posted a .943 OPS in 418 Triple-A plate appearances, then a .528 OPS in 147 Angels PA. Guzman produced a .974 OPS in 268 Triple-A PA and .602 in 304 major-league PA. Those are reasons to preserve development opportunities and reasons to provide alternatives. Neither player's minor-league line can be pasted into a major-league projection.
Grissom's .693 OPS is useful context for a player moving among several jobs. His 87 strikeouts in 474 PA show a different contact profile from Neto's, but his .307 on-base percentage and defensive results limit the case for making him an unquestioned everyday answer at one position. Peraza's .616 OPS is an improvement on his 2025 season, yet remains a modest offensive foundation for a regular role.
| Hitter | 2024 MLB PA / OPS | 2025 MLB PA / OPS | 2026 MLB PA / OPS |
|---|---|---|---|
| Zach Neto | 602 / .761 | 554 / .793 | 704 / .766 |
| Mike Trout | 126 / .866 | 556 / .798 | 634 / .803 |
| Vaughn Grissom | 114 / .465 | No MLB season | 474 / .693 |
| Nolan Schanuel | 607 / .705 | 564 / .742 | 446 / .736 |
| Oswald Peraza | 11 / .773 | 265 / .473 | 370 / .616 |
| Josh Lowe | 387 / .693 | 435 / .649 | 343 / .633 |
| Wade Meckler | No MLB season | No MLB season | 337 / .760 |
| Denzer Guzman | No MLB season | 43 / .566 | 304 / .602 |
| Jose Siri | 448 / .621 | 36 / .292 | 251 / .713 |
| Moisés Ballesteros | No MLB season | 66 / .868 | 352 / .612 |
| Christian Moore | No MLB season | 184 / .654 | 147 / .528 |
| Tyler Heineman | 16 / .396 | 174 / .777 | 200 / .443 |
| Bryce Teodosio | 12 / .166 | 150 / .552 | 76 / .510 |
The three-year view separates a genuine track record from a short breakthrough. Trout's 2025 and 2026 OPS figures were nearly identical. Schanuel's 2026 OPS was close to 2025. Josh Lowe's sequence declined from .693 to .649 to .633. Meckler's .760 in 337 PA is encouraging, but it is his first substantial major-league sample in this window. The plan gives each a job sized to that evidence.
| Batter / full MLB year | wOBA | xwOBA | SLG / xSLG |
|---|---|---|---|
| Zach Neto | 0.336 | 0.317 | 0.436 / 0.412 |
| Mike Trout | 0.354 | 0.381 | 0.421 / 0.487 |
| Vaughn Grissom | 0.306 | 0.309 | 0.386 / 0.380 |
| Nolan Schanuel | 0.328 | 0.334 | 0.385 / 0.389 |
| Oswald Peraza | 0.276 | 0.272 | 0.334 / 0.330 |
| Josh Lowe | 0.279 | 0.284 | 0.360 / 0.372 |
| Wade Meckler | 0.341 | 0.314 | 0.387 / 0.359 |
| Denzer Guzman | 0.267 | 0.265 | 0.336 / 0.327 |
| Jose Siri | 0.308 | 0.304 | 0.417 / 0.425 |
| Moisés Ballesteros | 0.274 | 0.290 | 0.331 / 0.361 |
| Christian Moore | 0.239 | 0.254 | 0.276 / 0.313 |
| Tyler Heineman | 0.204 | 0.236 | 0.220 / 0.259 |
| Bryce Teodosio | 0.234 | 0.210 | 0.243 / 0.232 |
Expected statistics describe contact and related outcomes under the model's definitions. They help identify where results and underlying contact diverged. They are not forecasts, and the gap between wOBA and expected wOBA is not a bank of runs waiting to be collected next year.
Use platoons where the evidence is useful
Schanuel had a .780 OPS against right-handed pitching and .615 against left-handers. Meckler's corresponding figures were .800 and .554, while Josh Lowe's were .674 and .420. The latter two left-handed-pitching samples contained only 56 and 55 PA. That is enough to justify competition and flexible lineup construction, not enough to pronounce a permanent inability.
| Batter / full MLB season | LHP PA / OPS | RHP PA / OPS |
|---|---|---|
| Zach Neto | 192 / .865 | 512 / .727 |
| Mike Trout | 179 / .831 | 455 / .792 |
| Vaughn Grissom | 178 / .722 | 296 / .676 |
| Nolan Schanuel | 119 / .615 | 327 / .780 |
| Oswald Peraza | 137 / .715 | 233 / .559 |
| Josh Lowe | 55 / .420 | 288 / .674 |
| Wade Meckler | 56 / .554 | 281 / .800 |
| Denzer Guzman | 106 / .676 | 198 / .563 |
| Jose Siri | 126 / .738 | 125 / .687 |
| Moisés Ballesteros | 62 / .572 | 290 / .621 |
| Christian Moore | 52 / .591 | 95 / .494 |
| Tyler Heineman | 55 / .336 | 145 / .485 |
Grissom and Peraza give the manager right-handed alternatives, although their own batting records do not justify assuming that every platoon substitution creates an advantage. Siri's .738 OPS against left-handers and .687 against right-handers also argues for a role more specific than a blanket offensive dismissal.
The preferred allocation leaves Trout available for some outfield work, Grissom for first base and the infield, and Peraza for middle-infield coverage. That flexibility has a cost: those players need actual defensive preparation for the assigned positions. A favorable split cannot erase the run-prevention consequences of where a substitute stands.
Defense needs a measured response
The strongest defensive improvement in this group belongs to Schanuel, whose OAA moved from minus-five in 2024 and minus-two in 2025 to plus-four in 2026. Neto's sequence was minus-five, minus-eight and minus-eight. His repeated negative results deserve attention to positioning, range and execution rather than an assumption that everyday availability makes the problem disappear.
| Fielder | 2024 OAA | 2025 OAA | 2026 OAA | 2026 opportunities |
|---|---|---|---|---|
| Zach Neto | -5 | -8 | -8 | 537 |
| Mike Trout | -1 | -2 | -5 | 297 |
| Vaughn Grissom | -2 | No row | -13 | 326 |
| Nolan Schanuel | -5 | -2 | +4 | 269 |
| Oswald Peraza | +0 | +2 | -1 | 304 |
| Josh Lowe | -2 | -4 | +2 | 181 |
| Wade Meckler | No row | No row | +1 | 165 |
| Denzer Guzman | No row | -5 | -1 | 247 |
| Jose Siri | +16 | +0 | -4 | 172 |
| Christian Moore | No row | -2 | -3 | 130 |
| Bryce Teodosio | +0 | +10 | +5 | 59 |
| Trent Grisham | +2 | -2 | -6 | 280 |
| Matt Vierling | +0 | +0 | +2 | 174 |
Grissom's minus-13 OAA across his 2026 work is the largest warning among the retained hitters. The response is a more controlled set of assignments and competition, not an unsupported claim that he can become a premium defender by changing positions. Moore's minus-three and Guzman's minus-one came in smaller opportunity sets and should be interpreted with those samples in view.
Teodosio's plus-five OAA in 59 opportunities is promising but too small to scale linearly into an elite full-season total. His plus-ten in 2025 adds useful context. Siri's plus-16 in 2024 and minus-four in 2026 show why an older reputation should not settle the present decision. The internal center-field competition should measure current range and routes alongside offense.
OAA is measured in outs, not runs, and it is not added directly to the pitching or batting model. The table preserves both the multi-year range and the 2026 opportunity count. A small sample and a missing row are different things.
Kelly gives the catching plan room to work
Ballesteros caught 153.1 innings for the Angels after his arrival. His full major-league batting sample was 352 PA with a .612 OPS, compared with .540 in his 177 Angels PA. His receiving development and his offense both require attention. A zero in a non-catching OAA row says nothing useful about his ability to handle the catching workload.
Heineman's full-season catching value was plus-8.47 runs, including plus-5.87 framing runs. Those figures span his entire major-league season, not just his 301 Angels catching innings. His .443 full-season OPS presents the opposing cost. He can provide a defensive role without being asked to carry an everyday offensive assignment.
| Catcher | 2026 LAA catching IP | Full MLB framing | Full MLB catching value |
|---|---|---|---|
| Moisés Ballesteros | 153.1 | -1.48 | Unknown |
| Tyler Heineman | 301.0 | +5.87 | +8.47 |
| Carson Kelly | External candidate | +1.02 | -1.03 |
| Ryan Jeffers | External candidate | -1.31 | -2.24 |
Kelly's 425 PA, .712 OPS and .320 wOBA offer a steadier offensive baseline than the returning alternatives. His .311 expected wOBA counsels restraint, and his minus-1.03 overall catching run value prevents selling him as a universal defensive upgrade. The proposed two-year, $16-20 million ceiling buys 400 PA and 90 catching starts. Ballesteros retains 40 catching starts plus first-base and DH work.
Jeffers is the more productive offensive comparison, with an .814 OPS and .344 expected wOBA. His existing qualifying offer makes availability and acquisition cost conditional, however. He is not silently substituted at a bargain salary. Higashioka remains a Texas player, and a trade would need a separate price and roster review. Neither is included in the funded plans.
The rotation starts with Detmers and Urena
Detmers' 185 innings, 211 strikeouts and 48 walks support the strongest retained starter case. A 3.36 ERA and 3.30 expected ERA broadly agree. The preferred plan assigns 30 starts and 175 innings, slightly below his completed workload. Urena receives 28 starts and 155 innings after 148.1 innings with a 2.97 ERA and 3.30 expected ERA.
| Pitcher / MLB ID | GS / LAA IP | ERA / full MLB xERA | K / BB / HR | Planning treatment |
|---|---|---|---|---|
| Reid Detmers / 672282 | 32 / 185.0 | 3.36 / 3.30 | 211 / 48 / 19 | Primary starter |
| Walbert Ureña / 700712 | 27 / 148.1 | 2.97 / 3.30 | 142 / 68 / 10 | Retain; walk rate limits margin |
| Ryan Johnson / 696270 | 19 / 100.0 | 5.04 / 4.86 | 79 / 43 / 18 | Internal rotation; run-prevention test |
| Grayson Rodriguez / 680570 | 20 / 98.2 | 6.02 / 5.69 | 85 / 43 / 16 | Reduced workload; performance risk |
| Yusei Kikuchi / 579328 | 14 / 67.2 | 4.92 / 4.76 | 67 / 30 / 7 | 115 IP only if ready; expanded from 2026 |
| Jack Kochanowicz / 686799 | 13 / 64.0 | 6.19 / 5.62 | 47 / 36 / 7 | TJ recovery; zero main-plan IP |
| George Klassen / 691946 | 6 / 27.0 | 3.67 / 5.58 | 24 / 21 / 2 | Depth; walks and xERA caution |
| Caden Dana / 702674 | 0 / 0 | No LAA sample / No row | 0 / 0 / 0 | AAA evidence; promotion gate |
| Mitch Farris / 815083 | 0 / 60.0 | 4.05 / 4.95 | 63 / 29 / 10 | Starter and relief coverage |
| Sam Aldegheri / 691951 | 6 / 33.2 | 5.08 / 5.51 | 22 / 17 / 5 | Bulk depth |
| José Soriano / 667755 | 22 / 123.0 | 3.29 / 4.45 | 127 / 57 / 12 | Toronto departure; no retained IP |
Urena's 68 walks are the caution. The next improvement is better strike throwing without sacrificing the contact outcomes that made his season useful. A low ERA does not remove the risk created by that many free baserunners. Ryan Johnson, Rodriguez and Klassen face different versions of the same workload question: which innings can they provide effectively, rather than merely occupy?
Rodriguez's 6.02 ERA and 5.69 expected ERA make an automatic rebound difficult to underwrite. Johnson's 5.04 and 4.86 do the same. Their planned 90 innings apiece preserve opportunities while limiting how much of the season depends on immediate improvement. Klassen's 3.67 ERA in 27 MLB innings is less reassuring beside 21 walks and a 5.58 expected ERA.
Kikuchi's proposed 115 innings exceed his 67.2 in 2026. That is a conditional workload, not a medical conclusion. The report includes a named replacement branch. Kochanowicz remains outside the principal rotation, so the plan does not need a precise recovery date to reach 162 starts.
Mahle purchases a specific block of innings
Mahle's full 2026 season comprised 149 innings, 137 strikeouts and 46 walks, with a 3.99 ERA and 3.95 expected ERA. His 1.99 ERA in 54.1 Atlanta innings should not eclipse the 5.13 ERA in 94.2 San Francisco innings. The full-season evidence is the appropriate basis for a 150-inning proposal.
At two years and $28-32 million, the annual ceiling is $14-16 million. That is the same range tested in the Cardinals and Royals work. Here the marginal job is clearer than a generic instruction to add pitching: Mahle removes 150 innings from the combined Klassen, Dana and Aldegheri alternative. The cost buys a more established performance record and reduces the development burden on those three pitchers.
The strongest objection is that Los Angeles is spending meaningful money on a pitcher who does not transform the top of the rotation. That is true. The recommendation follows from the roster's need for usable innings behind Detmers and Urena, with limited confidence in several other options. If Mahle's market price rises above the ceiling or the health review cannot support the workload, the Angels should use the internal branch or re-price a different starter. They should not pretend an empty allowance supplies his innings.
Relief needs command more than a new label
The Angels walked 639 batters in 1,430.1 innings in 2026, approximately 4.02 per nine. A single reliever cannot repair that team-wide problem. Clarke is proposed for a limited, identifiable contribution: 65 middle- and later-inning relief innings at one year and $4-6 million.
| Pitcher | LAA IP | ERA / full MLB xERA | K / BB | Treatment |
|---|---|---|---|---|
| Samy Natera Jr. | 31.2 | 3.13 / 2.51 | 48 / 13 | Promising 31.2-IP sample |
| José Fermin | 53.2 | 3.86 / 4.60 | 62 / 25 | Retain; command work |
| Sam Bachman | 48.2 | 4.81 / 4.03 | 49 / 29 | Walks limit leverage |
| Tayler Saucedo | 21.1 | 2.53 / 2.72 | 26 / 7 | Retain; small MLB sample |
| Blake Weiman | 17.2 | 2.55 / 3.03 | 16 / 3 | Low-walk small sample |
| Ryan Watson | 16.1 | 2.20 / 4.69 | 22 / 4 | Full-season xERA is less favorable |
| Ben Joyce | 15.1 | 4.11 / 3.81 | 18 / 9 | 30 IP conditional on readiness |
| Brett Kerry | 13.2 | 3.95 / 3.03 | 12 / 2 | Depth; AAA starter results weaker |
| Luke Murphy | 20.0 | 6.75 / 4.35 | 20 / 11 | Run-prevention improvement needed |
| Trevor Martin | 4.0 | 4.50 / 5.65 | 2 / 3 | Only four LAA innings |
| Ryan Zeferjahn | 51.2 | 3.66 / 3.10 | 75 / 32 | Cubs departure |
| Chase Silseth | 39.2 | 2.72 / 4.09 | 48 / 22 | Texas departure |
| Brent Suter | 63.1 | 4.12 / 3.95 | 55 / 17 | Departed |
Clarke walked 14 and struck out 45 in 73 innings. His 2.96 ERA was substantially better than his 4.42 expected ERA, so the price should reflect a command-oriented depth role rather than a dominant closer. That distinction matters when comparing him with harder-throwing internal pitchers who have walked too many hitters.
Natera's 48 strikeouts and 13 walks in 31.2 innings, alongside a 2.51 expected ERA, make him an interesting retained option. The sample remains small. Fermin, Bachman and Joyce each need a realistic command and readiness assessment before their workloads expand. Weiman's three walks in 17.2 innings are useful evidence, but no more reason to project a full season without qualification than a few poor outings would be to discard him.
The plan distributes 575 relief innings among 14 pitchers over the season. It does not assume those pitchers are simultaneously active or that the late-inning hierarchy is settled in November. Joyce receives 30 conditional innings, with a separate replacement allocation if he cannot provide them.
Keep the farm's horizons separate
Rada's 585 Triple-A plate appearances, .739 OPS and 72 walks support a center-field opportunity if his defense and major-league readiness clear. Three home runs describe the present power contribution. The plan asks for 250 PA and 55 center-field starts after selection, leaving Siri and Teodosio meaningful work rather than declaring the competition finished.
| Player / MLB ID | 2026 level and sample | Readiness decision |
|---|---|---|
| Nelson Rada / 703185 | AAA: 585 PA, .739 OPS, 3 HR; 72 BB / 109 K | Conditional CF opportunity; no MLB performance assigned |
| Christian Moore / 695681 | AAA: 418 PA, .943 OPS, 11 HR; 73 BB / 94 K | Earn 2B role; AAA success did not yet carry to MLB |
| Denzer Guzman / 694203 | AAA: 268 PA, .974 OPS, 12 HR; 27 BB / 48 K | 3B competition; strong AAA, weak MLB sample |
| Caden Dana / 702674 | AAA: 93.0 IP, 5.52 ERA; 86 K / 60 BB | Command work before expanded rotation burden |
| George Klassen / 691946 | AAA: 91.0 IP, 3.96 ERA; 88 K / 46 BB | Depth; assess 46 walks in 91 AAA IP |
| Brett Kerry / 695049 | AAA: 119.0 IP, 7.03 ERA; 98 K / 50 BB | Prefer limited bulk role over assumed rotation fix |
| Sam Aldegheri / 691951 | AAA: 100.1 IP, 7.45 ERA; 90 K / 57 BB | Internal alternative has substantial performance risk |
| Austin Gordon / 803135 | AA: 124.1 IP, 4.78 ERA; 134 K / 41 BB | Conditional injury replacement; promotion required |
| Camden Minacci / 695229 | AA: 47.2 IP, 3.59 ERA; 61 K / 21 BB | 15 late-season relief IP only after selection |
| Tyler Bremner / 803285 | AA: 24.1 IP, 4.44 ERA; 36 K / 8 BB | AA development; no main-plan MLB innings |
| Tyler Bremner / 803285 | High-A: 48.1 IP, 4.28 ERA; 64 K / 19 BB | High-A sample separate from AA |
| Arjun Nimmala / 805796 | AA: 126 PA, .966 OPS, 8 HR; 21 BB / 29 K | Longer-horizon shortstop; no 2027 workload |
| Jacob Cozart / 695524 | AA: 119 PA, .831 OPS, 7 HR; 15 BB / 32 K | 119 AA PA are not an immediate catching solution |
Nimmala's 126 Rocket City PA included eight home runs and a .966 OPS. Bremner's 24.1 Double-A innings followed 48.1 at High-A. Those are development records, not evidence that either must be rushed into a major-league vacancy. MLB Pipeline's current list places Nimmala first in the organization with a 2028 ETA and Bremner second with a 2027 ETA. An ETA is an editorial estimate, not a promised debut date.
Cozart's 119 Rocket City PA provide a catching prospect to follow, not a substitute for buying present catching depth. Gordon's 124.1 AA innings and 134 strikeouts make him a conditional rotation contingency, but 23 home runs allowed require scrutiny. Minacci's 61 strikeouts and 21 walks in 47.2 innings support a small late-season relief branch after promotion and selection.
No preferred acquisition spends prospect capital. Nimmala, Bremner and Rada are not assumed trade currency merely because a veteran is available. A future trade proposal must identify the actual controlled player, the job gained, the outgoing cost and the development work displaced. This analysis does not invent another club's willingness to accept a package.
Compare the purchases before choosing them
| Candidate / MLB ID | Full 2026 MLB evidence | S&S ceiling / decision |
|---|---|---|
| Carson Kelly / 608348 | 425 PA, .712 OPS, 10 HR; 0.320/0.311 wOBA/xwOBA | A/B: 2 years / $16-20M; 400 PA, 90 C starts |
| Tyler Mahle / 641816 | 149.0 IP, 3.99 ERA, 3.95 xERA; 137 K / 46 BB | A: 2 years / $28-32M; 28 GS, 150 IP |
| Taylor Clarke / 664199 | 73.0 IP, 2.96 ERA, 4.42 xERA; 45 K / 14 BB | A/B: 1 year / $4-6M; 65 relief IP |
| Trent Grisham / 663757 | 484 PA, .703 OPS, 18 HR; 0.311/0.337 wOBA/xwOBA | B: 2 years / $18-22M; 500 PA, 110 CF starts |
| Ryan Jeffers / 680777 | 369 PA, .814 OPS, 14 HR; 0.353/0.344 wOBA/xwOBA | Conditional comparison only; pending qualifying offer; not funded |
| Kyle Higashioka / 543309 | 186 PA, .676 OPS, 7 HR; 0.303/0.295 wOBA/xwOBA | Texas player, not a free-agent purchase; no trade assumed |
| Matt Vierling / 663837 | 291 PA, .590 OPS, 5 HR; 0.258/0.304 wOBA/xwOBA | Detroit player; injury and trade gates; not funded |
| Randal Grichuk / 545341 | 280 PA, .880 OPS, 15 HR; 0.370/0.335 wOBA/xwOBA | Corner alternative; does not solve CF or catching |
Kelly is preferred because the Angels need a larger catching share with a workable offensive baseline. Mahle takes a defined rotation workload. Clarke improves the mix of relief command at a limited price. Each acquisition displaces specific internal work, and none is justified solely by appearing in an earlier team review.
Grisham offers an alternative use of the rotation money: 500 PA, 110 center-field starts and a modest corner-field share. His .337 expected wOBA was better than his .311 actual wOBA, but his minus-six OAA prevents treating him as an automatic defensive upgrade. The alternative accepts more internal pitching risk in exchange for a more established offensive center-field option.
Vierling is a different type of inquiry, but he remains in Detroit's organization and on its reported injury list at this snapshot. No trade availability or medical readiness is assumed. Grichuk's .880 full-season OPS is attractive, yet his role would be in a corner or at DH, where the Angels already need to allocate Trout, Ballesteros and other hitters. His .335 expected wOBA also argues against paying exclusively for the best surface result.
Separate salary allocation from cash
Trout and Kikuchi account for $58.116667 million of retained 2027 salary allocation on the RosterResource basis used here. Trout's figure includes allocated bonus treatment and differs from his contract AAV. Kikuchi is in the final year of his three-year agreement.
| Player / MLB ID | 2027 allocation | Basis |
|---|---|---|
| Mike Trout / 545361 | $37.116667M | 2027 salary plus allocated bonus; AAV $35.541667M |
| Yusei Kikuchi / 579328 | $21.000000M | Final year of 3-year, $63M agreement |
| TOTAL | $58.116667M | Rendon deferred cash remains separate and unknown |
The eleven arbitration estimates total $34.9 million. They are estimates, not settlements. Neto's $9.8 million and Detmers' $7.5 million are the largest. All eleven remain in the financial model, including players with limited proposed workloads. The model does not obtain a cheaper roster by assuming a non-tender and then retaining the same player's production.
| Player | Estimate, $M | Treatment |
|---|---|---|
| Reid Detmers | 7.50 | Unsigned estimate; no assumed non-tender savings |
| Jose Siri | 2.30 | Unsigned estimate; no assumed non-tender savings |
| Josh Lowe | 3.60 | Unsigned estimate; no assumed non-tender savings |
| Tyler Heineman | 1.50 | Unsigned estimate; no assumed non-tender savings |
| Tayler Saucedo | 1.50 | Unsigned estimate; no assumed non-tender savings |
| Zach Neto | 9.80 | Unsigned estimate; no assumed non-tender savings |
| Grayson Rodriguez | 2.10 | Unsigned estimate; no assumed non-tender savings |
| Ben Joyce | 1.10 | Unsigned estimate; no assumed non-tender savings |
| Nolan Schanuel | 3.00 | Unsigned estimate; no assumed non-tender savings |
| Oswald Peraza | 1.40 | Unsigned estimate; no assumed non-tender savings |
| Sam Bachman | 1.10 | Unsigned estimate; no assumed non-tender savings |
| TOTAL | 34.90 | Eleven retained players |
Add $12-16 million for pre-arbitration players, minor-league roster costs and callups. The resulting existing-roster allocation is $105.016667-109.016667 million. This is a planning envelope for players, not the club's complete operating cost or a statement of available ownership funding.
Rendon's deferred $38 million obligation has no disclosed annual payment schedule. Its eventual cash installments must be added when known. They cannot be divided evenly by assumption or treated as zero because the player is no longer on the roster. The declined $2.5 million Stephenson option is excluded. Any separately confirmed residual cash obligation would need to be added to the financial picture.
| Component | Annual allocation | Definition |
|---|---|---|
| Trout and Kikuchi | $58.116667M | Allocation basis, not cash or CBT |
| Eleven arbitration estimates | $34.90M | Retained unless actual later decision changes status |
| Pre-arb, minors and callups | $12-16M | Planning pool; not yet contracted |
| Existing-roster envelope | $105.02-109.02M | Does not claim total club cash cost |
| Rendon deferred obligation | Annual cash unknown | Reported $38M deferred; no equal-installment assumption |
| Declined Stephenson option | $2.5M option excluded | Residual cash obligation unverified |
| RosterResource tax estimate | $114.108334M | Different AAV/benefit basis; incomplete future roster |
The tax estimate uses a different combination of AAV, benefits and other charges. It is not interchangeable with cash or this player-allocation model. A payroll figure below a tax threshold would not, by itself, establish that the owner has authorized spending up to that threshold.
Three plans, three different burdens
Plan A adds Kelly at $8-10 million annually over two years, Mahle at $14-16 million over two years and Clarke at $4-6 million for one year. The separate $6-8 million reserve raises annual additions to $32-40 million. New commitments, counting both years of the proposed multi-year contracts and the first-year reserve, total $54-66 million.
| Plan | Annual additions | Total allocation | New commitment |
|---|---|---|---|
| A: Kelly / Mahle / Clarke | $32-40M | $137.02-149.02M | $54-66M |
| B: Kelly / Grisham / Clarke | $27-35M | $132.02-144.02M | $44-56M |
| C: Internal roster | $6-8M | $111.02-117.02M | $6-8M |
Plan B substitutes Grisham for Mahle. Kelly and Clarke remain. Annual additions become $27-35 million, with $44-56 million in new commitments and reserved capacity. The total allocation is $132.02-144.02 million. This plan is cheaper because the center-field contract costs less than the rotation purchase. It also gives the organization 150 more starter innings to cover.
Plan C retains only the $6-8 million reserve, producing $111.02-117.02 million in player allocation. It shifts Kelly's catching work and Clarke's relief innings to named internal players, while also replacing Mahle. The reserve has no plate appearances, innings or wins assigned to it. It remains financial capacity until a real player and cost are identified.
If any proposed signing brings draft-pick or international-pool consequences, those costs require a fresh decision before execution. Current free-agent status does not settle a later qualifying-offer decision, medical review or price. A changed market can alter the preferred route without making the original price ceiling a factual error.
Allocate the lineup before adding another bat
The preferred plan totals 6,200 plate appearances. Neto receives 650, Trout and Schanuel 550 each, Moore 500, and Grissom, Guzman and Josh Lowe 450 each. Kelly receives 400, Ballesteros 350 and Heineman 150. Rada's conditional 250 PA come from a defined center-field competition, not an assumption that every prospect will receive a full season.
| Hitter | PA | Condition |
|---|---|---|
| Zach Neto | 650 | Health, performance and role gates |
| Mike Trout | 550 | Health, performance and role gates |
| Nolan Schanuel | 550 | Health, performance and role gates |
| Christian Moore | 500 | Health, performance and role gates |
| Vaughn Grissom | 450 | Health, performance and role gates |
| Denzer Guzman | 450 | Health, performance and role gates |
| Josh Lowe | 450 | Health, performance and role gates |
| Wade Meckler | 400 | Health, performance and role gates |
| Jose Siri | 250 | Health, performance and role gates |
| Bryce Teodosio | 250 | Health, performance and role gates |
| Moises Ballesteros | 350 | Health, performance and role gates |
| Carson Kelly | 400 | Proposed acquisition |
| Tyler Heineman | 150 | Health, performance and role gates |
| Oswald Peraza | 250 | Health, performance and role gates |
| Nelson Rada | 250 | Promotion and selection required |
| Nacho Alvarez Jr. | 150 | Health, performance and role gates |
| Gustavo Campero | 100 | Health, performance and role gates |
| Logan Porter | 50 | Health, performance and role gates |
| TOTAL | 6200 | Season allocation, not simultaneous active roster |
The 6,200 total is a planning device, not a prediction of how often the team will bat. It forces the report to acknowledge opportunity cost. More work for one catcher means less for another; a new center fielder changes the development opportunities available to Siri, Teodosio, Rada and Meckler.
The defensive schedule assigns 162 starts at each position, including DH, and keeps every individual below 162 combined starts. Trout has 70 outfield starts and 60 at DH. Grissom's work is spread among first, second, third and DH rather than treating him as an unchecked defensive solution. Ballesteros has catching, first-base and DH assignments that fit around the other hitters.
| Pos. | 162-start allocation | Condition |
|---|---|---|
| C | Kelly 90; Ballesteros 40; Heineman 27; Porter 5 | Seasonal allocation, not one fixed daily lineup |
| 1B | Schanuel 120; Grissom 20; Ballesteros 22 | Seasonal allocation, not one fixed daily lineup |
| 2B | Moore 120; Peraza 25; Grissom 17 | Seasonal allocation, not one fixed daily lineup |
| 3B | Guzman 100; Grissom 45; Alvarez 17 | Seasonal allocation, not one fixed daily lineup |
| SS | Neto 145; Peraza 17 | Seasonal allocation, not one fixed daily lineup |
| LF | Trout 55; Meckler 60; Campero 20; Lowe 12; Teodosio 15 | Seasonal allocation, not one fixed daily lineup |
| CF | Siri 60; Teodosio 47; Rada 55 | Seasonal allocation, not one fixed daily lineup |
| RF | Lowe 105; Meckler 40; Trout 15; Campero 2 | Seasonal allocation, not one fixed daily lineup |
| DH | Trout 60; Ballesteros 25; Schanuel 10; Neto 10; Grissom 30; Moore 5; Guzman 10; Alvarez 12 | Seasonal allocation, not one fixed daily lineup |
These are full-season allocations, with bench appearances and substitutions still possible. They do not certify that each player is available for every assigned game. The named branches below show how the plan changes when an acquisition or a major player is removed.
Cover 162 starts without a recovery windfall
The preferred rotation accounts for 162 starts and 865 innings. Detmers, Urena and Mahle provide 480 innings combined. Kikuchi, Rodriguez and Johnson supply another 295. Klassen, Dana and Farris cover the remaining 90. That distribution reduces reliance on the weakest recent major-league results without eliminating internal competition.
| Pitcher | GS / IP | Condition |
|---|---|---|
| Reid Detmers | 30 / 175 | Health, selection and performance review |
| Walbert Urena | 28 / 155 | Health, selection and performance review |
| Tyler Mahle | 28 / 150 | Proposed acquisition |
| Yusei Kikuchi | 22 / 115 | Clinical readiness and workload expansion gate |
| Grayson Rodriguez | 18 / 90 | Health, selection and performance review |
| Ryan Johnson | 18 / 90 | Health, selection and performance review |
| George Klassen | 10 / 50 | Health, selection and performance review |
| Caden Dana | 5 / 25 | Health, selection and performance review |
| Mitch Farris | 3 / 15 | Health, selection and performance review |
| TOTAL | 162 / 865 | Kochanowicz excluded from main workload |
The bullpen contributes 575 separately assigned innings, bringing the season model to 1,440. Farris has 15 starter innings and 45 relief innings, so his 60 total is not counted twice. Aldegheri's main-plan work is in relief; a no-Mahle branch adds starter work explicitly. Those distinctions are necessary when a pitcher can serve more than one role.
| Pitcher | IP | Condition |
|---|---|---|
| Samy Natera Jr. | 60 | Health, roster and performance gate |
| Jose Fermin | 55 | Health, roster and performance gate |
| Sam Bachman | 50 | Health, roster and performance gate |
| Tayler Saucedo | 50 | Health, roster and performance gate |
| Blake Weiman | 40 | Health, roster and performance gate |
| Ryan Watson | 45 | Health, roster and performance gate |
| Ben Joyce | 30 | Clinical readiness; no assumed full recovery |
| Taylor Clarke | 65 | Proposed acquisition |
| Mitch Farris | 45 | Health, roster and performance gate |
| Sam Aldegheri | 40 | Health, roster and performance gate |
| Brett Kerry | 35 | Health, roster and performance gate |
| Luke Murphy | 30 | Health, roster and performance gate |
| Trevor Martin | 15 | Health, roster and performance gate |
| Camden Minacci | 15 | Promotion and 40-man selection required |
| TOTAL | 575 | 865 starter innings plus relief = 1,440 |
The assumed 1,440 innings are a standardized planning total. Actual team innings vary with shortened games, extra innings and road losses. The point is to test whether the proposed staff has enough named capacity, not to forecast the exact final number to the third of an inning.
Make the failure branches visible
Without Mahle, Klassen and Dana each add ten starts and 50 innings, while Aldegheri adds eight starts and 50 innings. That is a numerically complete replacement with substantial performance risk. Dana walked 60 batters in 93 Triple-A innings; Aldegheri had a 7.45 ERA there. Calling the internal alternative complete does not make it equally dependable.
| Change from A | Removed workload | Named replacement |
|---|---|---|
| B/C: no Mahle | 28 GS / 150 IP | Klassen +10/50, Dana +10/50, Aldegheri +8/50 |
| B: add Grisham | 500 internal PA | Siri -150, Teodosio -100, Rada -150, Meckler -100; CF110 from Siri40/Teodosio30/Rada40; RF10 and LF5 from Meckler |
| C: no Kelly | 400 PA; 90 C starts | Ballesteros +150 PA / 45 C; Heineman +150 / 35 C; Porter +100 / 10 C |
| C: no Clarke | 65 relief IP | Natera +10, Fermin +10, Bachman +5, Weiman +10, Watson +10, Kerry +10, Murphy +10 |
| No Kikuchi | 22 GS / 115 IP | Klassen +8/40; Dana +8/40; Gordon +6/35 after selection |
| No Joyce | 30 relief IP | Weiman +10; Watson +10; Kerry +10 |
| No Trout | 550 PA; 55 LF / 15 RF / 60 DH | Lowe +100 PA, Meckler +100, Rada +100, Ballesteros +100, Grissom +50, Campero +50, Teodosio +50; LF to Meckler25/Campero15/Teodosio15; RF to Lowe15; DH to Ballesteros25/Grissom20/Schanuel15 |
| Multiple simultaneous losses | Rebuild scenario | Recalculate combined PA, positions and innings; isolated branches are not automatically additive |
The no-Kelly branch adds 150 PA and 45 catching starts to Ballesteros, 150 PA and 35 catching starts to Heineman, and 100 PA and ten catching starts to Porter. It puts a larger offensive burden on a group whose current evidence is weaker than Kelly's. The no-Clarke branch divides 65 innings among seven retained pitchers without crediting an unnamed replacement with league-average performance.
The no-Trout branch also has a price. It adds work to seven hitters and reassigns his field and DH starts. It does not replace his 107 walks by arithmetic. Multiple simultaneous losses require a new combined allocation because individual branches can compete for the same player's capacity. The report does not stack every fallback and claim the resulting roster still works.
Why the shared names fit differently here
Kelly appears in the Twins, Reds and Cubs work at a similar annual ceiling. In Chicago the job is retention within an existing catching group; in Minnesota he is a conditional alternative to Jeffers. Here he is a new purchase for 400 PA and 90 catching starts, displacing work from Ballesteros, Heineman and Porter while preserving Ballesteros' development. The job and opportunity cost are specific to Los Angeles.
Mahle's proposed $14-16 million annual range is consistent with the Cardinals and Royals comparisons. The Angels assign 150 innings, compared with the Cardinals' 140. That modest workload difference does not justify inventing a new market quote. It reflects how much internal risk each club is trying to replace. Clarke receives the same $4-6 million command-oriented role used in other reviews, with 65 innings here rather than an unsupported closer premium.
Grisham is preferred in the Royals' offensive center-field branch but remains an alternative here. The Angels have Rada's development opportunity and greater reason to protect the rotation floor. The explicit no-acquisition route supplies a further test of whether these players add enough marginal value to justify their cost.
These scenarios are independent evaluations. They do not assume Kelly, Mahle or Clarke can sign with several clubs simultaneously. If one becomes unavailable, the relevant plan loses that player and must be rebuilt. No outgoing prospects are charged in the preferred free-agent plan, and no trade target is treated as obtainable without a separately priced transaction.
The distance to contention remains substantial
Preventing 40 runs while holding scoring constant would move the margin from minus-97 to minus-57. Adding 30 runs of offense as well would bring it to minus-27. Scoring 50 more and allowing 60 fewer would produce a plus-13 margin. Those are useful scales for the problem, not forecasts of what the three signings will deliver.
| Illustrative change from 2026 | RS / RA | Margin | 162-game simple run-ratio wins |
|---|---|---|---|
| Unchanged runs | 655 / 752 | -97 | 69.9 |
| Prevent 40; same offense | 655 / 712 | -57 | 74.3 |
| Score 30 more; prevent 40 | 685 / 712 | -27 | 77.9 |
| Score 50 more; prevent 60 | 705 / 692 | +13 | 82.5 |
| Score 30 fewer; allow 30 more | 625 / 782 | -157 | 63.1 |
The run-ratio column uses 162 times runs scored squared divided by the sum of runs scored squared and runs allowed squared. It ignores sequencing, schedule and other influences on actual wins. The baseline already exceeds the Angels' actual 62 wins, so adding its apparent shortfall to a projected player improvement would count the same uncertainty twice.
The strongest argument against Plan A is that $32-40 million in annual additions may buy stabilization without a credible postseason leap. The response is a staged roster decision. Preserve the young players' opportunities, reduce the most avoidable workload risks and reassess against actual 2027 progress. Do not sacrifice a longer-term prospect simply to make the winter transaction list look more ambitious.
A decision sequence for the winter
Los Angeles is seeking a manager and permanent general manager as Kroenke Sports & Entertainment's purchase is expected in early 2027. That uncertainty makes an asserted ownership payroll limit especially unreliable. The baseball plan should survive a change in leadership because its roles, prices and alternatives are explicit.
First establish the actual player budget and separate deferred cash obligations. Then evaluate the Kelly and Mahle jobs, since those purchases most directly reduce the burden on unproven or limited alternatives. Pursue Clarke for the command role at the stated ceiling. Keep the center-field competition open unless Grisham's price and current evidence make the alternative a better use of resources.
Before the season, reassess Kikuchi's proposed workload, Joyce's readiness, the young infielders' defense and the roster space required for Rada or Minacci. During the season, judge progress by strike throwing, contact quality, defensive chances and the quality of the development opportunities. Those measures are more useful than declaring success because a short run of one-run results reverses.
The recommendation is Plan A within its price limits. It improves catching depth and the pitching middle while retaining room to learn about the young roster. If those purchases cannot be completed, the alternatives show the real burden that returns to the organization.
Player register and reading the evidence
| Player / MLB ID | Raw official roster status | Planning note |
|---|---|---|
| Ben Joyce / 690829 | Active | Role and clinical readiness evaluated separately |
| Blake Weiman / 676620 | Active | Role and clinical readiness evaluated separately |
| Brett Kerry / 695049 | Active | Role and clinical readiness evaluated separately |
| Bryce Teodosio / 669326 | Active | Role and clinical readiness evaluated separately |
| Caden Dana / 702674 | Active | Role and clinical readiness evaluated separately |
| Christian Moore / 695681 | Active | Role and clinical readiness evaluated separately |
| Denzer Guzman / 694203 | Active | Role and clinical readiness evaluated separately |
| George Klassen / 691946 | Active | Role and clinical readiness evaluated separately |
| Grayson Rodriguez / 680570 | Active | Role and clinical readiness evaluated separately |
| Gustavo Campero / 672569 | Active | Role and clinical readiness evaluated separately |
| Jack Kochanowicz / 686799 | Active | TJ recovery; zero main-plan IP |
| Jose Siri / 642350 | Active | Role and clinical readiness evaluated separately |
| Josh Lowe / 666139 | Active | Role and clinical readiness evaluated separately |
| José Fermin / 820862 | Active | Role and clinical readiness evaluated separately |
| Logan Porter / 682515 | Active | Role and clinical readiness evaluated separately |
| Luke Murphy / 684665 | Active | Role and clinical readiness evaluated separately |
| Mike Trout / 545361 | Active | Role and clinical readiness evaluated separately |
| Mitch Farris / 815083 | Active | Role and clinical readiness evaluated separately |
| Moisés Ballesteros / 694208 | Active | Role and clinical readiness evaluated separately |
| Nacho Alvarez Jr. / 805373 | Active | Role and clinical readiness evaluated separately |
| Nicolo Pinazzi / 695950 | Active | Role and clinical readiness evaluated separately |
| Nolan Schanuel / 694384 | Active | Role and clinical readiness evaluated separately |
| Oswald Peraza / 672724 | Active | Role and clinical readiness evaluated separately |
| Reid Detmers / 672282 | Active | Role and clinical readiness evaluated separately |
| Ryan Johnson / 696270 | Active | Role and clinical readiness evaluated separately |
| Ryan Watson / 670245 | Active | Role and clinical readiness evaluated separately |
| Sam Aldegheri / 691951 | Active | Role and clinical readiness evaluated separately |
| Sam Bachman / 696147 | Active | Role and clinical readiness evaluated separately |
| Samy Natera Jr. / 696519 | Active | Role and clinical readiness evaluated separately |
| Tayler Saucedo / 642048 | Active | Role and clinical readiness evaluated separately |
| Trevor Martin / 694680 | Active | Role and clinical readiness evaluated separately |
| Tyler Heineman / 623168 | Active | Role and clinical readiness evaluated separately |
| Vaughn Grissom / 687093 | Active | Role and clinical readiness evaluated separately |
| Wade Meckler / 685133 | Active | Role and clinical readiness evaluated separately |
| Walbert Ureña / 700712 | Active | Role and clinical readiness evaluated separately |
| Yusei Kikuchi / 579328 | Active | Role and clinical readiness evaluated separately |
| Zach Neto / 687263 | Active | Role and clinical readiness evaluated separately |
This roster is dated November 3, 2026. A player's presence and administrative status are separate from medical readiness, option availability, projected role and future contract decisions. The financial and workload tables identify proposed additions separately from retained players, and historical Angels contributors remain separate from the current roster.
PA means plate appearances; OPS is on-base percentage plus slugging percentage. wOBA is a weighted offensive measure and expected wOBA is Statcast's modeled counterpart. ERA is earned runs per nine innings, while xERA uses expected offensive outcomes on an ERA scale. OAA measures outs above average. Catching run values use their own component definitions and are not interchangeable with OAA.
Baseball innings notation is not decimal arithmetic: .1 means one out and .2 means two. The report's season workload plans use whole innings, and source innings retain baseball notation. Team-specific rows and full MLB rows are labeled because traded players can have materially different samples. Missing metrics remain unknown; they are not zeroes.
The analysis uses public evidence and independently proposed price ceilings. It does not claim access to private medical files, contract negotiations or ownership instructions. Later transactions and market decisions can change these dated conclusions.
Go to the sources
See something that needs attention? Read our corrections process.