Team analysis · 2027 roster planning
Make the Twins harder to beat
November 3, 2026 edition
The complete review
November 3, 2026 edition. Completed 2026 regular-season performance with November 3 roster, transaction and market checks. The full website analysis includes 24 evidence and planning tables; the 29-page PDF is suitable for forwarding. Proposed prices and workloads are scenarios.
The recommendation: buy fewer free baserunners
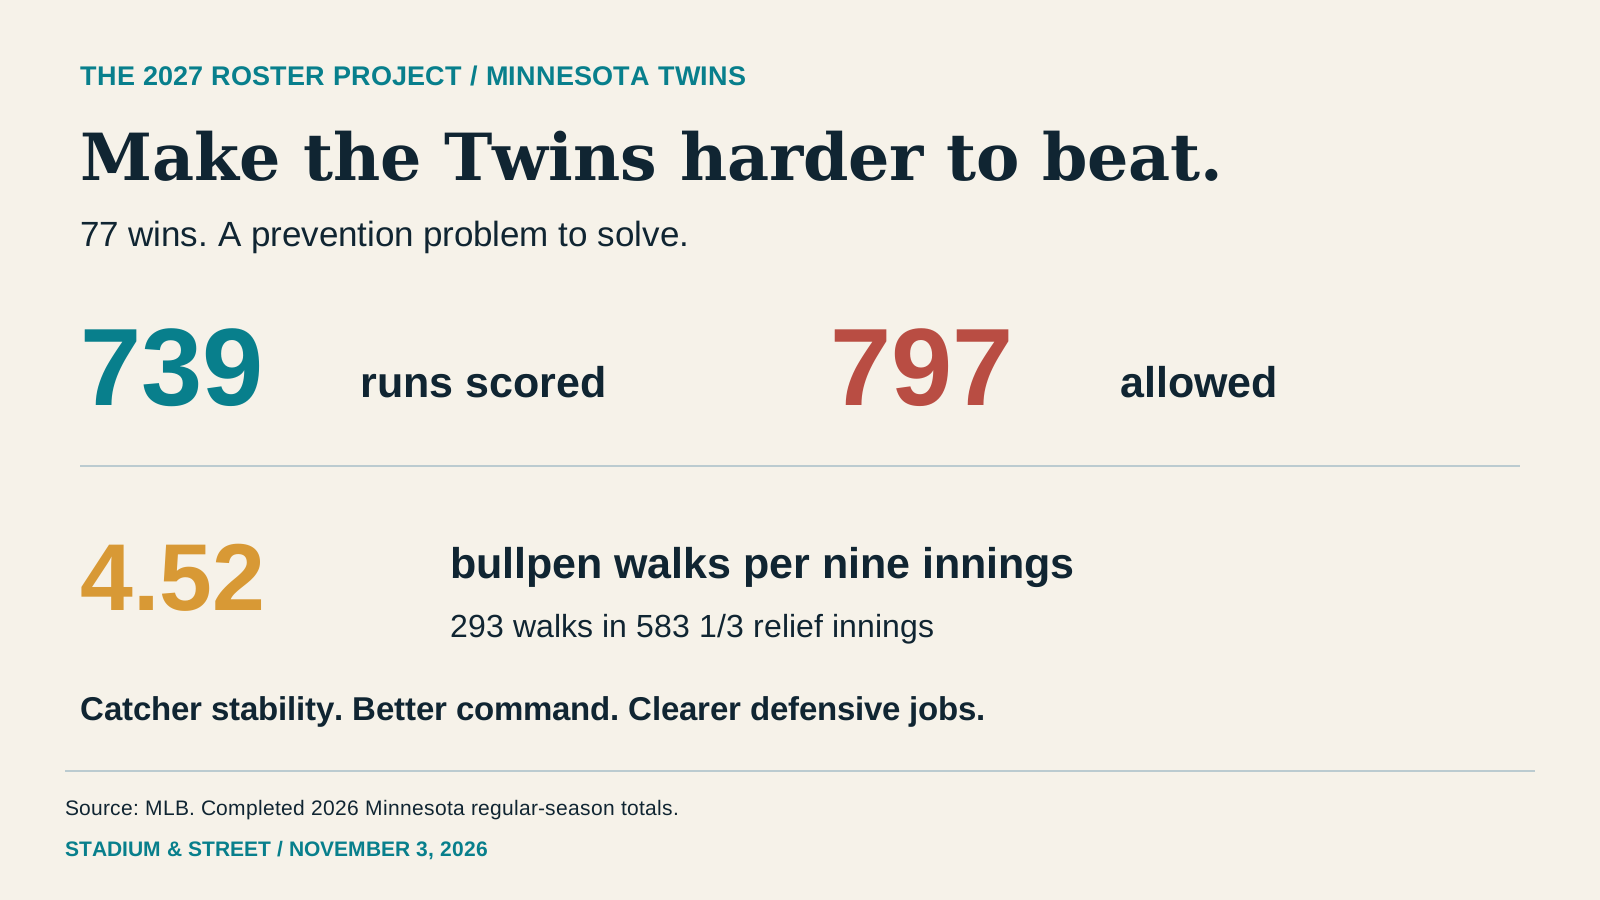
Minnesota scored 739 runs in 2026, ninth in the majors, and still finished 77-85. The pitching staff allowed 797 runs. The bullpen walked 293 batters in 583 1/3 innings. A winter centered on finding another designated hitter would leave the larger problem largely intact.
The preferred plan keeps a credible starting catcher, purchases two relievers with better recent walk records and reduces the defensive burden on several useful hitters. Ryan Jeffers' existing $23.15 million qualifying offer supplies the first conditional branch. Steven Okert is the preferred left-handed relief inquiry at an S&S ceiling of two years and $16-20 million. Andrew Kittredge is the complementary right-handed inquiry at one year and $5-7 million. Retain another $5-7 million for depth and injuries. These limits are proposed judgments, not reported demands, offers or agreements.
That plan requires an annual allocation of approximately $161.73-171.73 million, including an existing-roster envelope of $120.58-124.58 million. It is an expensive response to a team that won 77 games. The argument for it rests on preserving catcher offense while improving the innings that repeatedly became difficult to finish. It does not rest on assuming that spending a particular amount buys a particular win total.
If Jeffers declines and a reunion cannot be completed on acceptable terms, Carson Kelly is a different catcher alternative at two years and $16-20 million. Plan B combines that purchase with the same two relievers and reserve, for approximately $146.58-158.58 million. Plan C makes no major external purchase and shifts the work internally. Its lower cost comes with a much weaker catching safety net and more innings assigned to pitchers whose command already needs improvement.
Pohlad has promised a larger payroll without disclosing a ceiling. Minnesota should settle that ceiling before shopping. A club cannot responsibly promise catcher retention, bullpen improvement and another impact bat while budgeting only enough money for one of them.
The offense improved faster than the prevention
| Season | Record | Runs for / against | Margin | OPS / ERA |
|---|---|---|---|---|
| 2024 | 82-80 | 742 / 735 | +7 | .726 / 4.26 |
| 2025 | 70-92 | 678 / 773 | -95 | .707 / 4.55 |
| 2026 | 77-85 | 739 / 797 | -58 | .720 / 4.56 |
The Twins added 61 runs of offense from 2025 to 2026. Runs allowed also increased, by 24. Their run differential improved by 37, from minus-95 to minus-58, but the prevention side continued to absorb much of the gain. The club's seven additional wins represented progress without establishing a sound contention baseline.
The offensive improvement did not come from more home runs. Minnesota hit 187, four fewer than the year before. Walks rose from 495 to 507 and strikeouts fell from 1,372 to 1,297. The lineup created more opportunities and wasted fewer plate appearances, even with a number of individual weaknesses still visible. Those are useful developments to preserve.
The pitching staff finished with a 4.56 ERA, 25th in the majors. Its 727 earned runs were accompanied by another 70 runs classified as unearned. Unearned runs do not measure the full defensive cost, and they cannot all be assigned to range. They do show why examining only the pitchers' ERA leaves part of the team's actual scoring deficit outside the discussion.
The basic runs-squared relationship produces approximately 74.9 wins from 739 scored and 797 allowed. Minnesota actually won 77. That simple calculation is an illustration of the run environment, not an estimate of managerial value or an official projection. It reinforces the practical point: this was a team whose underlying scoring and prevention still required a substantial change.
Begin with the roster that exists now
Jeffers, A.J. Minter, Taylor Rogers and Josh Bell are free agents. Banda, Gray and Sabato were also outrighted into free agency. Those players' 2026 contributions remain part of the historical record. Their production is not automatically available to Minnesota in 2027.
Joe Ryan is a different case. MLB reported the decline of his mutual option, while he remains arbitration eligible. He therefore belongs in the returning pitching plan and the arbitration estimate, not in the free-agent departure column. Counting both his $13 million option and his projected arbitration salary would charge the same roster spot twice.
The November 3 administrative snapshot contains 37 named major-league roster players after removing Banda's lagging entry. The fresh roster has cleared the earlier administrative 60-day injured-list designations; the separate recovery conditions remain. This is an organizational membership snapshot, not a declaration that 37 players are healthy, occupy identical roster categories or can all make an Opening Day roster. The full register appears later in the report.
Alex Jackson remains listed with St. Paul after being outrighted. He is not on the major-league roster, and his future minor-league contract status needs to be resolved before assigning him a guaranteed 2027 job. James Outman and Simeon Woods Richardson left the organization during 2026. Justin Topa also left. The Cubs claimed Eric Orze on November 2. He receives no returning Minnesota innings in this plan. Jack Anderson is on the current Mets roster.
This distinction matters most in the bullpen. Minnesota cannot solve its walk problem by returning a fictional version of the staff that includes every reliever who appeared at any point in 2026. The retained pitchers, the available alternatives and the unfilled innings must each be identified separately.
The hitters: useful production, uneven protection
| Player / MLB ID | PA | AVG / OBP / SLG | HR | BB / K; context |
|---|---|---|---|---|
| Josh Bell / 605137 | 631 | .255 / .319 / .419 | 21 | 52 / 124; Departed FA |
| Brooks Lee / 686797 | 631 | .253 / .300 / .428 | 24 | 37 / 102; Primary 3B |
| Luke Keaschall / 807712 | 620 | .282 / .374 / .407 | 10 | 59 / 87; 2B / OF; DH option |
| Kody Clemens / 665019 | 583 | .239 / .298 / .460 | 27 | 39 / 127; 2B / 1B |
| Royce Lewis / 668904 | 509 | .227 / .287 / .380 | 15 | 38 / 130; Mostly 1B |
| Trevor Larnach / 663616 | 433 | .269 / .352 / .436 | 13 | 45 / 79; LF |
| Byron Buxton / 621439 | 408 | .254 / .319 / .511 | 25 | 30 / 100; CF; return contingent |
| Victor Caratini / 605170 | 382 | .220 / .312 / .315 | 7 | 34 / 80; C / 1B |
| Ryan Jeffers / 680777 | 369 | .256 / .353 / .461 | 14 | 46 / 66; FA; QO pending |
| Austin Martin / 668885 | 358 | .228 / .341 / .315 | 3 | 45 / 68; OF / utility |
| Ryan Kreidler / 668952 | 267 | .218 / .286 / .379 | 8 | 21 / 61; SS / utility |
| Matt Wallner / 670242 | 135 | .167 / .259 / .292 | 4 | 10 / 53; RF |
| Kaelen Culpepper / 701785 | 128 | .274 / .328 / .393 | 3 | 6 / 28; SS audition |
| Alan Roden / 702176 | 94 | .291 / .376 / .392 | 1 | 12 / 12; OF |
| Walker Jenkins / 805805 | 93 | .226 / .293 / .393 | 4 | 7 / 19; OF audition |
| Emmanuel Rodriguez / 691181 | 48 | .178 / .229 / .400 | 2 | 3 / 16; Small MLB sample |
Keaschall's .374 on-base percentage and Clemens' 27 home runs give Minnesota two different ways to sustain an inning. Buxton supplied 25 home runs in 408 plate appearances. Jeffers produced an .814 OPS in 369. These are productive pieces around which to organize a lineup, provided the plan distinguishes performance from health and contract status.
Bell's departure removes 631 plate appearances, 21 home runs and a .738 OPS. The response need not be a like-for-like designated-hitter purchase. Minnesota has several hitters whose offensive usefulness exceeds their defensive value. Reallocating the DH work can keep those bats available while improving the fielding alignment.
Lewis is the more difficult decision. His .227/.287/.380 line is inadequate for a player receiving most of his defensive work at first base. Retaining him is a bet that the bat can improve enough to justify the role, not an argument that former prospect status should determine the lineup. The plan gives him an opportunity while retaining alternatives at first and third.
Lee's 24 home runs and .728 OPS supplied real offense. His expected contact results were less convincing. Minnesota should not assume that his 2026 slugging percentage is now a floor, especially against left-handed pitching. The useful response is a more deliberate matchup plan, not an unsupported promise of either collapse or automatic improvement.
Expected statistics sharpen the questions
| Batter | wOBA | xwOBA | SLG / xSLG | Implication |
|---|---|---|---|---|
| Brooks Lee | 0.316 | 0.281 | 0.428 / 0.358 | Large contact-quality gap; protect difficult matchups |
| Luke Keaschall | 0.348 | 0.322 | 0.407 / 0.369 | On-base foundation; do not repeat every result |
| Kody Clemens | 0.327 | 0.334 | 0.460 / 0.456 | Power has contact-quality support |
| Royce Lewis | 0.292 | 0.306 | 0.380 / 0.397 | Some rebound room, not a restored middle-order bat |
| Trevor Larnach | 0.347 | 0.327 | 0.436 / 0.394 | Good season; more modest expected output |
| Byron Buxton | 0.355 | 0.343 | 0.511 / 0.488 | Power supported, availability remains separate |
| Ryan Jeffers | 0.353 | 0.344 | 0.461 / 0.430 | Offense has value beyond a one-year batting average |
| Victor Caratini | 0.285 | 0.306 | 0.315 / 0.356 | Expected output better than actual, still limited power |
| Matt Wallner | 0.253 | 0.281 | 0.292 / 0.333 | 135 PA are insufficient for a permanent verdict |
| Kaelen Culpepper | 0.320 | 0.287 | 0.393 / 0.351 | 128 PA require patience |
| Walker Jenkins | 0.303 | 0.310 | 0.393 / 0.394 | 93 PA do not settle the MLB job |
| Emmanuel Rodriguez | 0.270 | 0.354 | 0.400 / 0.534 | 48 PA are not a projection |
Lee's .316 wOBA exceeded his .281 expected wOBA, and his .428 slugging percentage exceeded an expected .358. That is a substantial difference. It does not invalidate the hits or home runs he produced. It makes repeating the same offensive line less comfortable as the central assumption of the next roster.
Keaschall also finished above his expected contact output, but the broader offensive foundation is stronger: he walked 59 times and struck out 87 in 620 plate appearances. The recommendation is to preserve that on-base value while reducing the defensive work that made his overall contribution more complicated.
Clemens' power is better supported by the contact-quality screen. His actual .460 slugging and expected .456 were close. That makes him a more defensible source of retained power than a simple comparison of home-run totals would reveal. His limitations against left-handers still matter when assigning everyday work.
Lewis' expected line was somewhat better than the actual result, but a .306 expected wOBA and .397 expected slugging do not establish an impact first baseman. A rebound can be plausible without being large enough to solve the position. The club should set an offensive standard for the job and retain the ability to change the allocation.
The smallest samples deserve the least certainty. Jenkins had 93 major-league plate appearances, Culpepper 128 and Emmanuel Rodriguez 48. Their minor-league records inform the next opportunity. None has already demonstrated a full season of major-league production.
Stop giving every hitter the same matchup
| Batter / scope | Against LHP: PA / OPS | Against RHP: PA / OPS |
|---|---|---|
| Brooks Lee | 207 / .579 | 424 / .800 |
| Luke Keaschall | 202 / .742 | 418 / .800 |
| Kody Clemens | 163 / .679 | 420 / .789 |
| Royce Lewis | 146 / .738 | 363 / .638 |
| Trevor Larnach | 55 / .572 | 378 / .819 |
| Byron Buxton | 115 / .741 | 293 / .864 |
| Ryan Jeffers | 139 / .802 | 230 / .820 |
| Victor Caratini | 126 / .544 | 256 / .667 |
| Austin Martin | 177 / .736 | 181 / .582 |
| Matt Wallner | 47 / .496 | 88 / .581 |
| Kaelen Culpepper | 49 / .749 | 79 / .704 |
| Carson Kelly / external | 136 / .871 | 289 / .638 |
| Tyler Stephenson / external | 117 / .655 | 351 / .748 |
Minnesota posted a .678 OPS against left-handed pitching and .739 against right-handers. Lee's own split was particularly large: .579 in 207 plate appearances against lefties and .800 in 424 against righties. Lewis went the other way, with .738 against left-handers and .638 against right-handers.
That creates a practical, limited adjustment. Selected starts for Lewis at third against left-handers can reduce some of Lee's least productive exposure. Clemens can cover first on some of those days, while the DH and outfield choices depend on the rest of the matchup. The purpose is to improve particular lineup decisions, not to declare a permanent platoon solely from one season.
Clemens' .679 OPS against lefties and .789 against righties also argue for flexibility. Keaschall's .742 and .800 split is less extreme, making him a useful stabilizing presence. The bench should be assembled around the actual uncovered matchups rather than filled with additional players who all require the same favorable conditions.
Kelly's appeal as an alternative catcher includes an .871 OPS against left-handed pitching, compared with .638 against right-handers. That is a reason to pair and deploy him carefully. It is not a reason to project his lefty-facing result over 500 unrestricted plate appearances. Plan B gives him 350, with additional work assigned to Caratini and the reserve catcher.
Put the defense where it can succeed
| Fielder | 2024 OAA | 2025 OAA | 2026 OAA | 2026 tracked opportunities |
|---|---|---|---|---|
| Byron Buxton | +4 | +3 | +3 | 210 |
| Luke Keaschall | No row | -2 | -12 | 451 |
| Kody Clemens | -1 | +4 | +1 | 444 |
| Brooks Lee | -2 | -4 | 0 | 453 |
| Royce Lewis | +1 | +1 | -4 | 352 |
| Trevor Larnach | +2 | -4 | -5 | 230 |
| Austin Martin | -7 | +1 | +2 | 206 |
| Ryan Kreidler | -1 | 0 | +2 | 230 |
| Matt Wallner | -3 | -4 | -4 | 92 |
| Kaelen Culpepper | No row | No row | +1 | 103 |
| Walker Jenkins | No row | No row | 0 | 62 |
| Emmanuel Rodriguez | No row | No row | +1 | 33 |
Keaschall's minus-12 Outs Above Average is the largest warning in this group. It covers his combined tracked defensive work, including second base and the outfield. It is not a minus-12 rating exclusively at second. Larnach finished at minus-5, Lewis and Wallner at minus-4 each. Those costs must be weighed against the offense each player supplies.
Buxton's plus-3 came in 210 tracked opportunities, following plus-3 in 2025 and plus-4 in 2024. The recent range evidence supports keeping him in center when available. His availability is a separate question. A good fielder who cannot cover the entire season still needs a specific replacement plan.
Lee's zero in 2026 followed minus-2 and minus-4 in the two prior seasons. Culpepper's plus-1 came in only 103 tracked opportunities. Kreidler's plus-2 came in 230. These are reasons to test a more stable left side, not enough evidence to award a large projected defensive gain in advance.
A reasonable planning test is whether the proposed alignment can recover roughly five to ten runs through reduced exposure and better deployment. That range is an S&S target, not a model projection. It is deliberately smaller than erasing every negative OAA value, because replacements also make mistakes, the position mix changes and year-to-year measurement varies. No such gain is separately added to the run scenarios later in the report.
| Player | 2026 Minnesota defensive innings | Proposed change |
|---|---|---|
| Luke Keaschall | CF 210.2; RF 451.2; 2B 636.1 | Reduce defensive exposure; expand DH, remove routine CF duty |
| Kody Clemens | 1B 366.1; LF 88.0; CF 49.1; 2B 576.1; RF 132.1 | Primary 2B; selective 1B |
| Brooks Lee | SS 400.0; 3B 939.2 | Retain primary 3B; limited SS |
| Royce Lewis | 1B 684.0; 2B 107.1; 3B 306.0 | 1B first, with selected 3B matchups |
| Kaelen Culpepper | SS 281.0 | Earn primary SS; Kreidler is real competition |
| Byron Buxton | CF 597.2 | Conditional CF work with scheduled DH coverage |
| Walker Jenkins | CF 211.2 | Share CF coverage; no assumed full-season production |
| Trevor Larnach | LF 809.1 | LF/DH, with late defensive replacement |
| Austin Martin | CF 47.0; RF 363.2; LF 324.2 | OF coverage and limited 2B |
| Matt Wallner | RF 284.0 | RF/DH trial, not a guaranteed everyday job |
The central change uses Bell's vacant DH work to reduce Keaschall's fielding volume. It also removes routine center-field assignments from Keaschall, distributes that work among Buxton, Jenkins and Martin, and preserves late-game defensive choices behind Larnach and Wallner. These are choices the existing roster can test before purchasing another position player.
Catching is a real purchase decision
| Catcher / full MLB season | Catching run value | Framing / throwing / blocking / ABS |
|---|---|---|
| Ryan Jeffers | -2.2 | -1.3 / -3.8 / +0.1 / +2.8 |
| Victor Caratini | +1.9 | +2.7 / -3.9 / +0.9 / +2.2 |
| Carson Kelly | -1.0 | +1.0 / -2.7 / +1.6 / -0.9 |
| Tyler Stephenson | -8.4 | -9.7 / -2.2 / +3.1 / +0.4 |
Jeffers' offensive production is the principal reason to retain him. The defensive table does not support selling him as an across-the-board receiving upgrade. His total catching run value was minus-2.2, with negative throwing and framing components offset in part by positive ABS value. Caratini finished at plus-1.9 overall.
Kelly's total was minus-1.0, while Stephenson's was minus-8.4, driven largely by a negative framing result. The different components explain why catcher selection cannot be reduced to one batting line. They also prevent the common error of adding framing, throwing, blocking and ABS values to a total that already includes them.
Jeffers has until November 17 to answer the $23.15 million qualifying offer. The offer is a real conditional obligation. If accepted, the Twins cannot treat the cost as optional merely because another catcher later appears cheaper. If declined, Minnesota can pursue another agreement or move to the alternative, with the consequences shown explicitly.
The strongest objection to retaining Jeffers is the opportunity cost. More than $23 million for one catcher could fund substantial pitching work, and the club has catching prospects. The answer is not to dismiss those prospects. It is to compare their present readiness with the work being vacated. Lackey has 52 High-A plate appearances. Tait has not reached Triple-A. A prospect's eventual upside does not supply April major-league catching innings.
The rotation needs coverage before another headline
| Pitcher / MLB ID | GS / MIN IP | ERA / xERA* | K / BB / HR | Context |
|---|---|---|---|---|
| Taj Bradley / 671737 | 31 / 178.1 | 3.73 / 3.98 | 205 / 76 / 23 | Largest completed workload |
| Joe Ryan / 657746 | 27 / 144.2 | 3.79 / 3.70 | 159 / 31 / 21 | Arbitration retained; option decline reported |
| Bailey Ober / 641927 | 24 / 131.0 | 4.47 / 4.66 | 96 / 37 / 21 | Contact and HR exposure |
| Dean Kremer / 665152 | 10 / 54.1 | 3.48 / 4.15 | 48 / 18 / 6 | MIN stint only; full MLB xERA |
| Connor Prielipp / 687570 | 22 / 125.2 | 4.87 / 3.95 | 128 / 44 / 14 | Expected contact result stronger than actual ERA |
| Zebby Matthews / 805673 | 23 / 130.1 | 4.90 / 4.38 | 116 / 39 / 24 | Home-run reduction needed |
| Andrew Morris / 702193 | 3 / 73.2 | 4.40 / 3.35 | 69 / 27 / 5 | Starter/bulk flexibility |
| Kendry Rojas / 696070 | 4 / 29.2 | 3.34 / 3.47 | 34 / 22 / 2 | Small MLB sample; command risk |
Bradley supplied 178 1/3 innings, Ryan 144 2/3, Ober 131, Matthews 130 1/3 and Prielipp 125 2/3. Those five form a substantial workload base. Kremer adds another established candidate, but his 54 1/3 Minnesota innings were only part of a 90 1/3-inning major-league season. His full-year ERA was 4.68, compared with 3.48 after the trade.
Ryan's 159 strikeouts and 31 walks make him especially important to the command objective. Bradley's 205 strikeouts give the rotation a different strength, although 76 walks limit how comfortable that workload was. The club should retain both jobs rather than create a new rotation vacancy to make a payroll total look smaller.
Prielipp's 4.87 ERA and 3.95 expected ERA suggest that contact outcomes were less discouraging than the actual run total. That is a reason to continue the development work. Matthews' 24 home runs in 130 1/3 innings and Ober's 21 in 131 show where improved strike throwing alone will not be enough. Location and contact management matter as well.
The plan does not purchase a starter simply because other dossiers did. Minnesota has six candidates for five rotation jobs and a substantial salary committed to Lopez. Its more immediate purchased need is in relief. That decision changes if the spring availability picture removes several starters, in which case the reserve and the payroll ceiling have to be reconsidered together.
Salary does not establish medical availability
Lopez, Festa, Abel, Paredes and Sands have cleared the administrative 60-day IL listings, but their recovery conditions and return dates remain separate. This plan assigns none of them a required opening workload. Lopez's $21.75 million remains in the budget. Removing his innings from the baseline does not remove his contract.
Hoffman and Buxton also require return checks before the proposed workloads can be adopted. Their allocations are conditional, and the plan carries replacement branches rather than assuming medical clearance. A preseason report that a player is progressing does not by itself establish how many games or innings he can handle.
If Lopez becomes available, he can displace part of the starting and bulk workload assigned to the depth group. His innings would replace other innings, not be added on top of a complete 1,440-inning staff. The same rule applies to the other injured pitchers. Their eventual returns would improve the quality and flexibility of the coverage, but they are not counted twice as both rehabilitation upside and baseline depth.
If Buxton is unavailable, Jenkins and Martin absorb more center-field responsibility, while Roden and Emmanuel Rodriguez take more corner work. That preserves a positional map without pretending the replacement offense equals Buxton's. A club that wants a stronger fallback must fund and identify it separately.
The bullpen's central weakness is measurable
| Pitcher | MIN IP | ERA / full MLB xERA | K / BB | 2027 treatment |
|---|---|---|---|---|
| Jeff Hoffman | 18.0 | 2.50 / 3.35 | 27 / 12 | Retained; availability gate |
| Yoendrys Gómez | 49.2 | 3.62 / 5.51 | 52 / 29 | Retained; ERA overstates contact-quality comfort |
| Travis Adams | 59.0 | 4.58 / 4.18 | 62 / 25 | Retained; improve strike throwing |
| Kody Funderburk | 51.0 | 3.71 / 3.73 | 49 / 27 | Retained; walk reduction needed |
| Tommy Nance | 26.2 | 4.05 / 4.45 | 34 / 11 | Retained; middle innings |
| Garrett Acton | 11.0 | 5.73 / 4.27 | 14 / 6 | Retained; small sample |
| Marco Raya | 6.0 | 3.00 / 5.02 | 4 / 3 | Retained; depth |
| A.J. Minter | 22.2 | 2.78 / 3.84 | 21 / 6 | Departed FA; retention alternative |
| Taylor Rogers | 60.1 | 4.33 / 4.12 | 54 / 31 | Departed FA; not funded |
| Anthony Banda | 34.1 | 4.46 / 4.51 | 33 / 15 | Departed FA after outright |
| Eric Orze | 41.1 | 5.66 / 4.15 | 36 / 21 | Historical MIN work; no 2027 allocation |
Minnesota's relievers walked approximately 4.52 batters per nine innings. Its starters walked approximately 3.04. The bullpen's 4.74 ERA reflects a staff that too often had to escape innings after supplying baserunners without requiring a hit. Buying another pitcher solely on the strength of saves or a low ERA can leave that mechanism unchanged.
Gomez illustrates the distinction. His Minnesota ERA was 3.62, but he walked 29 in 49 2/3 innings and finished with a full-season 5.51 expected ERA. He can remain useful. He should not be treated as a guaranteed late-inning answer whose result will repeat independent of the walks and contact.
Hoffman provides strikeouts: 102 in 66 innings across Toronto and Minnesota. His 18-inning Twins sample had 27 strikeouts but also 12 walks. A complete assessment keeps the full-year record and the smaller local sample visible. It does not assume that his 2.50 Minnesota ERA describes every future appearance.
Adams and Funderburk also have returning roles, but neither eliminates the command need. Adams walked 25 in 59 innings; Funderburk walked 27 in 51. If the same pitchers receive more innings without changing those rates, the lower-cost plan can reproduce the problem the club is trying to solve.
Two relief inquiries, with limits
| Candidate / MLB ID | Full 2026 MLB evidence | S&S ceiling / decision |
|---|---|---|
| Ryan Jeffers / 680777 | 369 PA, .814 OPS, 14 HR; 0.353/0.344 wOBA/xwOBA | Existing QO: $23.15M for one year; acceptance pending |
| Carson Kelly / 608348 | 425 PA, .712 OPS, 10 HR; 0.320/0.311 wOBA/xwOBA | Alternative: 2 years / $16-20M |
| Tyler Stephenson / 663886 | 468 PA, .727 OPS, 15 HR; 0.320/0.326 wOBA/xwOBA | Pass as preferred receiving solution |
| Steven Okert / 595345 | 67.2 IP, 2.13 ERA, 3.13 xERA; 68 K / 14 BB | Preferred LHP inquiry: 2 years / $16-20M |
| Andrew Kittredge / 552640 | 48.1 IP, 3.54 ERA, 4.01 xERA; 40 K / 11 BB | RHP command inquiry: 1 year / $5-7M |
| A.J. Minter / 621345 | 45.2 IP, 2.56 ERA, 3.84 xERA; 41 K / 8 BB | Retention alternative: 2 years / $14-18M |
| Tyler Alexander / 641302 | 73.0 IP, 3.70 ERA, 3.35 xERA; 60 K / 23 BB | Bulk alternative: 1 year / $4-6M |
| Sean Newcomb / 656794 | 90.1 IP, 3.09 ERA, 4.27 xERA; 84 K / 34 BB | Alternative, not preferred command purchase |
| Hoby Milner / 571948 | 42.0 IP, 3.64 ERA, 5.09 xERA; 25 K / 10 BB | Pass at impact-reliever pricing |
| Shawn Armstrong / 542888 | 35.1 IP, 4.58 ERA, 4.21 xERA; 34 K / 19 BB | Pass as command solution |
| Taylor Rogers / 573124 | 60.1 IP, 4.33 ERA, 4.12 xERA; 54 K / 31 BB | Pass as principal command purchase |
Okert walked 14 batters in 67 2/3 innings for Houston, with a 2.13 ERA and 3.13 expected ERA. That is approximately 1.86 walks per nine. His 2025 record also supports the command case: 19 walks in 71 2/3 innings. His 2024 performance was much weaker, with a 5.09 ERA in 35 1/3 innings. The recommendation reflects the two more recent seasons while retaining that downside.
At two years and $16-20 million, the proposed purchase is 60 innings of left-handed leverage and middle relief, not a promise of another 2.13 ERA. Those innings reduce the burden on the existing high-walk options. If the bidding exceeds the ceiling or the health review fails, Minter is a distinct retention alternative, with a proposed two-year limit of $14-18 million.
Minter walked eight in 45 2/3 major-league innings in 2026. His nine home runs and 3.84 expected ERA complicate the attractive 2.56 actual ERA. He also had only 11 major-league innings in 2025. The club would be purchasing a different availability and contact-risk profile, not obtaining Okert under another name.
Kittredge's 11 walks in 48 1/3 innings supply the right-handed complement. He will turn 37 before the 2027 season, and his 4.01 expected ERA was above his 3.54 actual ERA. That supports a one-year inquiry at $5-7 million rather than a long commitment. The workload is 50 innings, close to what he completed, with no automatic closer designation.
Tyler Alexander is the alternative when the uncovered job is bulk rather than leverage. He supplied 73 innings with a 3.70 ERA and 3.35 expected ERA, but his two prior major-league ERAs were 5.10 and 4.98. A one-year $4-6 million ceiling buys flexible coverage with regression risk. It should not be described as the same job as Kittredge's or as a substitute for every late-inning need.
Milner's 3.64 ERA came with a 5.09 expected ERA and 25 strikeouts in 42 innings. Armstrong walked 19 in 35 1/3. Rogers walked 31 in 60 1/3. Newcomb offers more length, but 34 walks in 90 1/3 innings and a 4.27 expected ERA make him a less direct answer to the particular command purchase proposed here. These are reasons to distinguish the candidates, not declarations that none can help a major-league club.
The young players need jobs, not honorary roster spots
| Player / MLB ID | 2026 level and sample | Readiness decision |
|---|---|---|
| Walker Jenkins / 805805 | AAA: 307 PA, .939 OPS, 12 HR, 42 BB / 48 K | Meaningful AAA evidence; conditional CF/RF work |
| Kaelen Culpepper / 701785 | AAA: 343 PA, .845 OPS, 14 HR, 39 BB / 63 K | Primary SS audition; MLB defense and contact must hold |
| Emmanuel Rodriguez / 691181 | AAA: 220 PA, .914 OPS, 11 HR, 42 BB / 58 K | On-base/power promise; smaller healthy sample |
| Hendry Mendez / 694230 | AAA: 335 PA, .788 OPS, 8 HR, 44 BB / 53 K | Useful depth, not assumed impact |
| Gabriel Gonzalez / 694224 | AAA: 480 PA, .745 OPS, 16 HR, 38 BB / 82 K | Larger sample; compete for OF role |
| Marek Houston / 701339 | AA: 286 PA, .829 OPS, 7 HR, 29 BB / 59 K | AA progress; no automatic April MLB PA |
| Vahn Lackey / 822518 | A+: 52 PA, 1.000 OPS, 2 HR, 14 BB / 8 K | 52 high-A PA; not the 2027 catching solution |
| Eduardo Tait / 806953 | A+: 520 PA, .699 OPS, 22 HR, 35 BB / 119 K | Power with contact development still required |
| Noah Cardenas / 681433 | AAA: 275 PA, .727 OPS, 13 HR, 39 BB / 69 K | Non-roster catching alternative; no MLB track record |
| Alex Jackson / 656577 | AAA: 95 PA, .806 OPS, 7 HR, 6 BB / 31 K | Non-roster depth; future contract rights require recheck |
| Ricardo Olivar / 691627 | AA: 137 PA, .978 OPS, 10 HR, 16 BB / 26 K | Injured-list status and limited upper-level sample |
| Kendry Rojas / 696070 | AAA: 38.0 IP, 2.84 ERA, 38 K / 12 BB | Rotation/bulk competition |
| Mike Paredes / 702474 | AAA: 34.2 IP, 3.38 ERA, 33 K / 8 BB | Health gate; no opening allocation |
| Marco Raya / 694397 | AAA: 64.1 IP, 5.32 ERA, 73 K / 24 BB | Relief depth; command must improve |
| Charlee Soto / 805792 | A: 2.2 IP, 16.88 ERA, 3 K / 1 BB | 2.2 innings do not justify MLB allocation |
Jenkins' .939 OPS in 307 Triple-A plate appearances and Culpepper's .845 in 343 are meaningful upper-level records. They justify substantial competitions for center-field and shortstop work. The major-league samples remain small enough that Minnesota needs alternatives at both positions. Kreidler and Martin are part of that coverage, not merely names at the bottom of the depth chart.
Emmanuel Rodriguez reached a .914 OPS in 220 Triple-A plate appearances. Hendry Mendez and Gabriel Gonzalez offer additional outfield depth with different recent samples and results. Giving all of them everyday major-league jobs would require more positions than the field contains. The season-long plate-appearance budget instead leaves room for readiness, injury replacement and performance-based changes.
Noah Cardenas is the most concrete internal catcher trial in the lower-cost branch: 275 Triple-A plate appearances, a .727 OPS, 13 home runs, 39 walks and 69 strikeouts. He has no established major-league catching record. Selecting his contract would require a roster move. A 270-plate-appearance assignment in Plan C is therefore a serious developmental and competitive risk, not free replacement production.
Lackey's combined early professional work is encouraging but distant from the job being priced. Tait's 22 High-A home runs came with a .699 OPS and 119 strikeouts in 520 plate appearances. Olivar's strong Double-A showing is accompanied by a short Triple-A sample and an injured-list designation. None should be rushed merely to avoid paying for the immediate catcher vacancy.
Repeated targets must survive a different comparison
Jeffers appears in the earlier Yankees and Marlins analyses, but the jobs differ. New York's dated inquiry was a catching complement alongside Wells. Miami's was support around Mack. Minnesota is evaluating retention of its own established offensive catcher. Here the alternative is a larger Caratini role and an unproven internal reserve, or the explicitly priced Kelly purchase. The 430-plate-appearance allocation and existing qualifying offer determine this club's cost discussion.
Kelly also appeared as a conditional alternative in the Yankees work. The new Minnesota proposal is a 350-plate-appearance role, weighted toward his stronger recent left-handed-pitching matchups, with Caratini carrying additional work. The $16-20 million two-year ceiling is an S&S valuation of that defined role. It is not evidence of an asking price or permission to assign the same free agent to several clubs at once.
Okert was a relief alternative in both earlier dossiers. Minnesota's 60-inning proposal displaces additional work that would otherwise fall to Morris, Rojas, Nance, Adams, Funderburk, Acton and Raya. That identifies the marginal benefit more clearly than comparing his ERA with a departed reliever's ERA. Kittredge supplies a separate 50-inning right-handed job; Alexander is a bulk alternative. Minter is a retention alternative with different health and home-run evidence.
No outgoing prospect package is assumed for these free-agent inquiries. There is therefore no invented trade return to subtract, but there are real costs: dollars, roster spots, reduced developmental innings and any applicable acquisition conditions. The Twins' own qualifying-offer position is accounted for separately. Any target whose status changes before negotiations requires a new transaction analysis.
The earlier Yankees and Marlins editions retain their October research and roster dates, with November acquisition amendments. They are not current availability lists. The present recommendation uses November 3 identities and transactions while preserving what those earlier comparisons actually said.
Build the budget from its components
| Player | 2027 allocation, $M | Basis |
|---|---|---|
| Pablo Lopez | 21.75 | Salary retained; zero guaranteed return innings |
| Byron Buxton | 15.142857 | Listed annual salary allocation |
| Jeff Hoffman | 12.666667 | Gross listed salary; separate bonus/trade offsets below |
| Victor Caratini | 6.5 | 2027 contract year |
| TOTAL | 56.059524 | Before the separate listed offsets |
| Player | Estimate, $M | Basis |
|---|---|---|
| Dean Kremer | 6.50 | Published projection; not signed salary |
| Bailey Ober | 6.90 | Published projection; not signed salary |
| Joe Ryan | 9.60 | Published projection; not signed salary |
| Trevor Larnach | 6.30 | Published projection; not signed salary |
| Royce Lewis | 5.10 | Published projection; not signed salary |
| Cole Sands | 1.30 | Published projection; not signed salary |
| Tommy Nance | 1.20 | Published projection; not signed salary |
| Kody Clemens | 3.60 | Published projection; not signed salary |
| Taj Bradley | 4.50 | Published projection; not signed salary |
| TOTAL | 45.00 | Nine retained cases; Banda removed, Ryan included once |
| Component | Annual allocation | Definition |
|---|---|---|
| Four contracts | $56.059524M | Gross salary columns; offsets below |
| Arbitration pool | $45.00M | Nine estimates; no assumed non-tender savings |
| Correa obligations | $11.333333M | $10M trade obligation plus $1.333333M signing-bonus line |
| Hoffman adjustments | -$5.416667M | -$1.666667M signing-bonus adjustment; -$3.75M Toronto support |
| Listed 2027 buyouts | $1.60M | Bell $1.25M; Ryan $0.1M; Topa $0.25M including escalator |
| Pre-arb, minors and callups | $12-16M | S&S allowance including minor-league 40-man salaries |
| Existing-roster envelope | $120.58-124.58M | Before catcher retention, external additions and depth reserve |
The four salary lines total $56.059524 million before the separate adjustments. The nine retained arbitration estimates total $45 million. Ryan appears once in that pool; Banda's projected $2.3 million is removed after his departure. No additional savings are assumed from non-tendering or trading another returning player.
The Correa and Hoffman lines require particular care. This model retains the listed $10 million Correa trade obligation and $1.333333 million signing-bonus allocation. It applies the separate negative $1.666667 million Hoffman bonus adjustment and $3.75 million Toronto contribution. The resulting net is $5.916666 million. These entries describe the chosen annual allocation basis, not a reconstruction of every cash payment date.
The listed 2027 buyouts total $1.6 million, including the Topa escalator. They are retained conservatively because payment timing has not been reconciled to club cash records. A later accounting confirmation could move a timing item; it cannot justify silently omitting an obligation today. Caratini's later-year option buyout is not treated as a 2027 operating purchase.
The $12-16 million pre-arbitration, minor-league and callup allowance includes the smaller roster salaries. Benefits, the separate pre-arbitration bonus pool, competitive-balance-tax accounting, draft and international spending, staff costs and unverified obligations are excluded. This is a baseball roster allocation, not the owner's full annual cash requirement or a CBT forecast.
Three paths, and the qualifying-offer branch
| Plan | Annual additions | Total allocation | New commitment* |
|---|---|---|---|
| A: Jeffers QO + two relievers | $41.15-47.15M | $161.73-171.73M | $49.15-57.15M |
| B: Kelly + two relievers | $26.00-34.00M | $146.58-158.58M | $42.00-54.00M |
| C: Internal roster; QO declined | $5.00-7.00M | $125.58-131.58M | $5.00-7.00M |
Plan A adds Jeffers' one-year $23.15 million qualifying-offer amount, $8-10 million annually for Okert, $5-7 million for Kittredge and a $5-7 million reserve. The total annual addition is $41.15-47.15 million. The multi-year commitment column includes both years of Okert's proposed deal, with the other stated components counted once.
Plan B substitutes Kelly at $8-10 million annually on a two-year agreement. It therefore adds $26-34 million annually, with $42-54 million of combined proposed commitment and reserved capacity across the stated terms. That branch is available only if the Jeffers obligation is not incurred or is otherwise replaced through an actual agreement. The model never buys both catchers while charging for only one.
Plan C adds only the $5-7 million reserve, for $125.58-131.58 million on the same allocation basis. The reserve is capacity for identified depth needs, not a player whose performance has been assumed. The no-acquisition branch deliberately shows a weaker internal roster so that declining a purchase remains a baseball decision with consequences.
| Decision | Cost change | Workload consequence |
|---|---|---|
| Jeffers accepts | $23.15M obligation | Retain catcher; C cannot simply delete his salary |
| Jeffers rejects; no reunion | $0 in base; activate alternative | B uses Kelly; C shifts to Caratini/Cardenas |
| Jeffers accepts; no external relief | $148.73-154.73M total | QO plus $5-7M reserve; internal relief inherits 110 IP |
| Long-term Jeffers agreement | Not priced or assumed here | Rebuild commitments and workloads before choosing it |
If Jeffers accepts but the club does not purchase either reliever, the total becomes approximately $148.73-154.73 million, including the reserve. The catching plan then retains Jeffers while the bullpen takes the internal 110-inning replacement burden. This branch prevents the qualifying offer from disappearing inside an artificially cheap fallback.
Account for all 6,200 plate appearances
| Player / role | PA | Opportunity |
|---|---|---|
| Keaschall | 630 | Primary DH/selected RF and 2B |
| Lee | 600 | Primary 3B; selective SS |
| Clemens | 540 | Primary 2B; selective 1B |
| Lewis | 470 | 1B; selected 3B and DH |
| Larnach | 450 | LF/DH |
| Buxton | 430 | CF/DH; return contingent |
| Jeffers | 430 | C/DH; QO acceptance or separate agreement |
| Caratini | 310 | C/1B |
| Culpepper | 430 | Primary SS audition |
| Jenkins | 400 | CF/RF audition |
| Martin | 350 | OF/2B coverage |
| Wallner | 240 | RF/DH trial |
| Emmanuel Rodriguez | 220 | OF; readiness dependent |
| Roden | 220 | OF depth |
| Kreidler | 180 | SS/3B/2B coverage |
| Hendry Mendez | 80 | OF depth |
| Gabriel Gonzalez | 80 | OF depth |
| Cardenas | 40 | C depth; 40-man selection needed |
| Ben Ross | 30 | IF depth |
| Other coverage | 70 | Injuries and roster changes |
| TOTAL | 6,200 | Season coverage, not 20 simultaneous roster spots |
The allocation is a season-long planning framework, not an Opening Day roster prediction. It includes injuries, minor-league promotions and replacement work. A hitter's opportunity depends on the relevant health, defensive and offensive tests. The total does not assume that every listed player occupies a major-league roster spot simultaneously.
Keaschall receives the largest share, with the DH opening helping preserve his offense while reducing fielding exposure. Lee, Clemens and Lewis retain meaningful work but no absolute claim to every matchup. Jenkins and Culpepper receive real opportunities, with enough coverage behind them to avoid turning development into an ultimatum.
| Change from Plan A | PA adjustment | Result |
|---|---|---|
| Plan B: Jeffers to Kelly | -430 / +350 | Kelly has 350 PA; target favorable matchups |
| Plan B: Caratini / Cardenas | +60 / +20 | 370 / 60 PA; net zero change |
| Plan C: remove Jeffers | -430 | No unbought catcher production |
| Plan C: Caratini / Cardenas | +200 / +230 | 510 / 270 PA; substantial workload and readiness risk |
| TOTAL | 6,200 in each plan | No catcher counted twice |
Plan B's Kelly allocation is smaller than Jeffers', with the remaining work divided between Caratini and Cardenas. Plan C asks Caratini for 510 plate appearances and Cardenas for 270. That is a substantial increase for both and the clearest weakness in the cheapest plan. The numbers make the missing purchase visible instead of crediting the lineup with Jeffers' production after removing his salary.
Account for every position
| Pos. | Proposed 162-start allocation | Purpose |
|---|---|---|
| C | Jeffers 95; Caratini 60; Cardenas 7 | Plan A only; separate alternative catcher map |
| 1B | Lewis 105; Clemens 32; Caratini 25 | Make Lewis earn the largest share |
| 2B | Clemens 110; Keaschall 35; Martin 17 | Reduce Keaschall defensive volume |
| 3B | Lee 135; Lewis 20; Kreidler 7 | Retain Lee at the position he actually played |
| SS | Culpepper 110; Kreidler 37; Lee 15 | Readiness-dependent shortstop competition |
| LF | Larnach 100; Martin 30; E. Rodriguez 20; Mendez 12 | Planned coverage and late defense |
| CF | Buxton 75; Jenkins 65; Martin 22 | Shared coverage; no routine Keaschall CF allocation |
| RF | Keaschall 60; Wallner 50; Roden 20; E. Rodriguez 20; Gonzalez 12 | Conditional opportunity, not four everyday jobs |
| DH | Keaschall 50; Larnach 40; Buxton 25; Lewis 5; Jeffers 10; Caratini 3; Other coverage 29 | Use Bell departure to reduce fielding exposure |
Each line totals 162 starts. This is a coverage test rather than a rigid calendar. Substitutions, injuries and performance will change the actual distribution. The DH coverage also allows the club to manage players whose bats remain useful when their defensive workload needs to decline.
Plan B changes the catcher line to approximately 80 Kelly starts, 70 Caratini starts and 12 for the reserve. Plan C requires roughly 100 Caratini starts and 62 from Cardenas or a genuinely established replacement. The latter is an especially demanding assumption for a player without a major-league record, which is why the cheapest branch is not the preferred competitive plan.
If Culpepper does not earn shortstop, Kreidler takes more of that work and Lee provides selected coverage. If Jenkins is not ready for the proposed center-field load, Martin's role expands. Those substitutions keep positions filled but do not guarantee the same offense. A meaningful upgrade requires a comparison with the actual replacement, not merely a more attractive name on paper.
Account for all 162 starts and 1,440 innings
| Pitcher / coverage | Starts / IP | Workload test |
|---|---|---|
| Bradley | 30 / 170 | Below 178.1 completed IP |
| Ryan | 29 / 160 | 15.1 IP above 2026; contingent durability |
| Ober | 25 / 135 | Near 2026 work; contact improvement needed |
| Kremer | 24 / 130 | Full-year role, not extrapolation from 54.1 MIN IP |
| Prielipp | 23 / 120 | Slightly below 2026 workload |
| Matthews | 20 / 100 | Additional 35 relief IP; 135 total |
| Morris | 4 / 20 | Additional 55 relief IP; 75 total |
| Rojas | 4 / 20 | Additional 40 relief IP; 60 total |
| Other healthy depth | 3 / 15 | No promised Lopez/Festa/Abel/Paredes return |
| TOTAL | 162 / 870 | Six primary candidates plus depth; not six simultaneous rotation slots |
The starting plan uses 870 innings. It asks Ryan for about 15 more innings than he completed in 2026 and Kremer for about 40 more than his full major-league total. Those are real workload assumptions. Bradley, Prielipp and the other established candidates provide the remainder, with Morris and Rojas serving as flexible coverage rather than being counted twice as full-time starters and full-time relievers.
| Pitcher / coverage | IP | Workload test |
|---|---|---|
| Hoffman | 55 | Return contingent; below full 66-IP 2026 total |
| Okert | 60 | Only if acquired; below 67.2-IP 2026 total |
| Kittredge | 50 | Only if acquired; near 48.1-IP 2026 total |
| Gomez | 50 | Command and contact risk; not guaranteed closer |
| Adams | 55 | Near prior workload |
| Funderburk | 45 | Below prior workload |
| Morris | 55 | Additional to 20 starter IP |
| Nance | 35 | Middle innings; full-year availability needed |
| Rojas | 40 | Additional to 20 starter IP |
| Matthews | 35 | Additional to 100 starter IP |
| Acton | 30 | Larger MLB role must be earned |
| Raya | 25 | Build from AAA relief work |
| Other healthy depth | 35 | No performance assigned to unspent reserve |
| TOTAL | 570 | 870 starter + 570 relief = 1,440 innings |
The 570 relief innings complete a 1,440-inning planning season. Matthews' 100 starter innings plus 35 in relief equal 135 overall. Morris' 20 plus 55 equal 75. Rojas' 20 plus 40 equal 60. These totals are checked together so that flexibility does not become fictitious capacity.
Hoffman's 55 innings remain conditional on readiness. If unavailable, the club has to transfer those innings to the reserve group or make a specific additional acquisition. The cost and expected performance of that response cannot be inferred from an unspent allowance. The same principle applies if multiple starters fail to reach their planned workloads.
What happens without the relievers
| Change from A/B | Relief IP change | Result |
|---|---|---|
| Okert / Kittredge | -60 / -50 | No acquired innings credited |
| Morris / Rojas | +20 / +15 | 75 / 55 relief IP; starter work remains separate |
| Nance / Adams | +15 / +10 | 50 / 65 relief IP |
| Funderburk / Acton | +10 / +15 | 55 / 45 relief IP |
| Raya / other depth | +10 / +15 | 35 / 50 relief IP |
| NET | 0 | 570 relief IP with greater internal command risk |
The internal branch replaces 110 innings assigned to Okert and Kittredge. Morris and Rojas absorb 35 of them, Nance and Adams another 25, Funderburk and Acton 25, and Raya plus the remaining depth 25. The total still works arithmetically. The quality and reliability of the work are less certain.
Morris would reach 95 combined starter and relief innings. Rojas would reach 75. Adams would have 65 relief innings, Funderburk 55, Acton 45 and Raya 35. These are not impossible workloads, but several would require more major-league responsibility than the recent evidence establishes. More innings from pitchers with unresolved walk rates can be a false economy even when their salaries are low.
The no-acquisition outcome is therefore a legitimate developmental strategy, not a disguised version of Plan A. It preserves money and opportunities while accepting greater risk that the bullpen continues to undermine an otherwise productive lineup. Ownership can choose that direction, but the competitive expectation should change with it.
How much improvement is actually needed
| Illustrative change from 2026 | RS / RA | Run margin | Simple run-ratio wins* |
|---|---|---|---|
| Unchanged runs | 739 / 797 | -58 | 74.9 |
| Prevent 40; scoring unchanged | 739 / 757 | -18 | 79.1 |
| Score 20 more; prevent 50 | 759 / 747 | +12 | 82.3 |
| Score 40 more; prevent 80 | 779 / 717 | +62 | 87.7 |
| Lose 25 runs; prevent only 20 | 714 / 777 | -63 | 74.2 |
Preventing 40 runs with unchanged scoring would still leave Minnesota at a minus-18 differential. Adding 20 runs and preventing 50 would create a plus-12 margin, corresponding to roughly 82.3 wins in the simple runs-squared illustration. Even adding 40 while preventing 80 produces approximately 87.7, not an automatic 90-win team.
These are transparent scenarios, not forecasts or independent player-value totals. The defensive deployment target, the relief command objective and the young hitters' development all feed into the same runs scored and allowed. Adding their supposed gains again on top of the scenario would double count the improvement.
The strongest countercase is that Minnesota is too far away to justify the preferred spending level. If the club cannot fund both catcher stability and prevention, a smaller plan with development at its center may be more coherent than a partial spending spree. The response is to set explicit review points: catcher contract resolution, spring health, shortstop and center-field readiness, and whether the bullpen actually throws enough strikes to justify its assignments.
The recommended plan earns its price only if those tests remain favorable. The opportunity is to turn a useful offense into a team that gives fewer games away. The discipline is to recognize when the evidence no longer supports the expensive version of that opportunity.
Current roster register and decision gates
| Player / MLB ID | Position | November 3 status |
|---|---|---|
| Alan Roden / 702176 | RF | Current major-league roster listing; role not guaranteed |
| Andrew Morris / 702193 | P | Current major-league roster listing; role not guaranteed |
| Austin Martin / 668885 | RF | Current major-league roster listing; role not guaranteed |
| Bailey Ober / 641927 | P | Current major-league roster listing; role not guaranteed |
| Ben Ross / 805346 | SS | Current major-league roster listing; role not guaranteed |
| Brooks Lee / 686797 | 3B | Current major-league roster listing; role not guaranteed |
| Byron Buxton / 621439 | CF | Current major-league roster listing; role not guaranteed |
| Cole Sands / 663485 | P | Active administrative roster; prior injury and return conditions remain |
| Connor Prielipp / 687570 | P | Current major-league roster listing; role not guaranteed |
| David Festa / 701581 | P | Active administrative roster; prior injury and return conditions remain |
| Dean Kremer / 665152 | P | Current major-league roster listing; role not guaranteed |
| Emmanuel Rodriguez / 691181 | CF | Current major-league roster listing; role not guaranteed |
| Gabriel Gonzalez / 694224 | RF | Current major-league roster listing; role not guaranteed |
| Garrett Acton / 670183 | P | Current major-league roster listing; role not guaranteed |
| Hendry Mendez / 694230 | OF | Current major-league roster listing; role not guaranteed |
| Jeff Hoffman / 656546 | P | Current major-league roster listing; role not guaranteed |
| Joe Ryan / 657746 | P | Mutual option decline reported; remains arbitration eligible |
| Kaelen Culpepper / 701785 | SS | Current major-league roster listing; role not guaranteed |
| Kendry Rojas / 696070 | P | Current major-league roster listing; role not guaranteed |
| Kody Clemens / 665019 | 2B | Current major-league roster listing; role not guaranteed |
| Kody Funderburk / 681892 | P | Current major-league roster listing; role not guaranteed |
| Luke Keaschall / 807712 | 2B | Current major-league roster listing; role not guaranteed |
| Marco Raya / 694397 | P | Current major-league roster listing; role not guaranteed |
| Matt Wallner / 670242 | RF | Current major-league roster listing; role not guaranteed |
| Mick Abel / 690953 | P | Active administrative roster; prior injury and return conditions remain |
| Mike Paredes / 702474 | P | Active administrative roster; prior injury and return conditions remain |
| Pablo López / 641154 | P | Active administrative roster; prior injury and return conditions remain |
| Royce Lewis / 668904 | 1B | Current major-league roster listing; role not guaranteed |
| Ryan Kreidler / 668952 | SS | Current major-league roster listing; role not guaranteed |
| Taj Bradley / 671737 | P | Current major-league roster listing; role not guaranteed |
| Tommy Nance / 667297 | P | Current major-league roster listing; role not guaranteed |
| Travis Adams / 701519 | P | Current major-league roster listing; role not guaranteed |
| Trevor Larnach / 663616 | LF | Current major-league roster listing; role not guaranteed |
| Victor Caratini / 605170 | C | Current major-league roster listing; role not guaranteed |
| Walker Jenkins / 805805 | CF | Current major-league roster listing; role not guaranteed |
| Yoendrys Gómez / 672782 | P | Current major-league roster listing; role not guaranteed |
| Zebby Matthews / 805673 | P | Current major-league roster listing; role not guaranteed |
The roster and transactions were rechecked November 3. Administrative activations are separate from healthy-role assumptions. Non-roster prospects and external free agents appear in the relevant analysis tables, not as current major-league roster members. The Twins' explicit announcement that Banda cleared waivers and would become a free agent controls over his lagging entry on the roster pages. He remains excluded from the 37-player retained register and the payroll estimate.
The next decisions are concrete. Resolve Jeffers' qualifying offer and any alternative catcher commitment. Confirm the available payroll. Check the returning players' actual readiness. Negotiate the relief jobs within their stated limits. Require Culpepper and Jenkins to earn the proposed assignments while keeping coverage available behind them.
If the relief purchases fail, use the explicit internal innings map. If the catcher purchase fails, acknowledge the larger Caratini and Cardenas burden. If a key player departs, remove both his workload and the applicable salary before rebuilding the plan. A complete roster is the result of those reconciled decisions, not the sum of every attractive option discussed in the winter.
Definitions and sources
Regular-season team and player totals are separated from postseason results. Minnesota-only statistics are labeled where a player also appeared for another club; expected statistics generally describe the full major-league season. Innings use baseball notation, with .1 and .2 representing one and two outs. Calculations convert those figures to outs rather than treating them as decimals.
wOBA summarizes offensive production with event weights; expected wOBA and expected slugging describe a contact-quality estimate rather than a guaranteed future result. Expected ERA is a diagnostic with similar limits. OAA describes tracked fielding range and is not a complete measure of defense. Catching run-value components are already included in the displayed catching total.
All acquisition prices, workloads, reserves and improvement scenarios are S&S judgments unless identified as a reported contract or published estimate. Annual allocation, multi-year commitment, cash timing and CBT accounting are different quantities. The runs-squared illustration is 162 multiplied by runs scored squared divided by the sum of runs scored squared and runs allowed squared. It is not an official projection.
Go to the sources
See something that needs attention? Read our corrections process.